

Big Picture
First part today is on yields and opportunities, and the second part is what to make of the OpenAi revenue figures we got this week. Big week for both.
To kick off… the yo-yo of the AI trade is almost like the yo-yo of the inflation thesis.
Our view is simple: all of AI should not trade as one trade as there are emerging differences between the power trade versus the chips trade versus the model trade, etc. Now even within those categories there are very big nuances I think investors need to begin paying close attention to as there is lots at stake there.
We have decided to go more into the cyber / identity space as that was always the “easiest” area to see where demand due to AI would flow. All you had to believe was more AI, not what chip or model or generator was being used. More importantly and economically, those are recurring relationships, as opposed to the non-recurring spend in a good portion of the AI infrastructure build.
We will update that within our upcoming quarterly letter which will go out, along with quarterly video so stay tuned.
Now rates have been rising, creating some concerns on the why… I think the why is pretty clear. Deficits cannot last forever, and in theory they should not last at all when it comes to the economic growth we are seeing. In theory, now is the time to balance it. But the wrench is war, which is a spending line, that war is creating some anxiety around inflation through commodity pricing, and the fact that economic activity is strong while we spend more has pushed up yields. Now real yields are up, so the signal is growth + deficits are the main culprit for yield moves. When real rates rise because the demand for capital is strong, that is a strength signal, not a distress one. HOWEVER, we think this is looking to subside somewhat, and the implication of that is what we shared back in May/June on rotation trade back into what we predominately own, and where we think there is real value in the market. We are investors, not traders. So staying close to the trades, but not reacting to the moves is our DNA unless something fundamentally changes. So we think rates stabilize, cyclical areas do better, non AI trade gets a lift. All things we have pointed to.
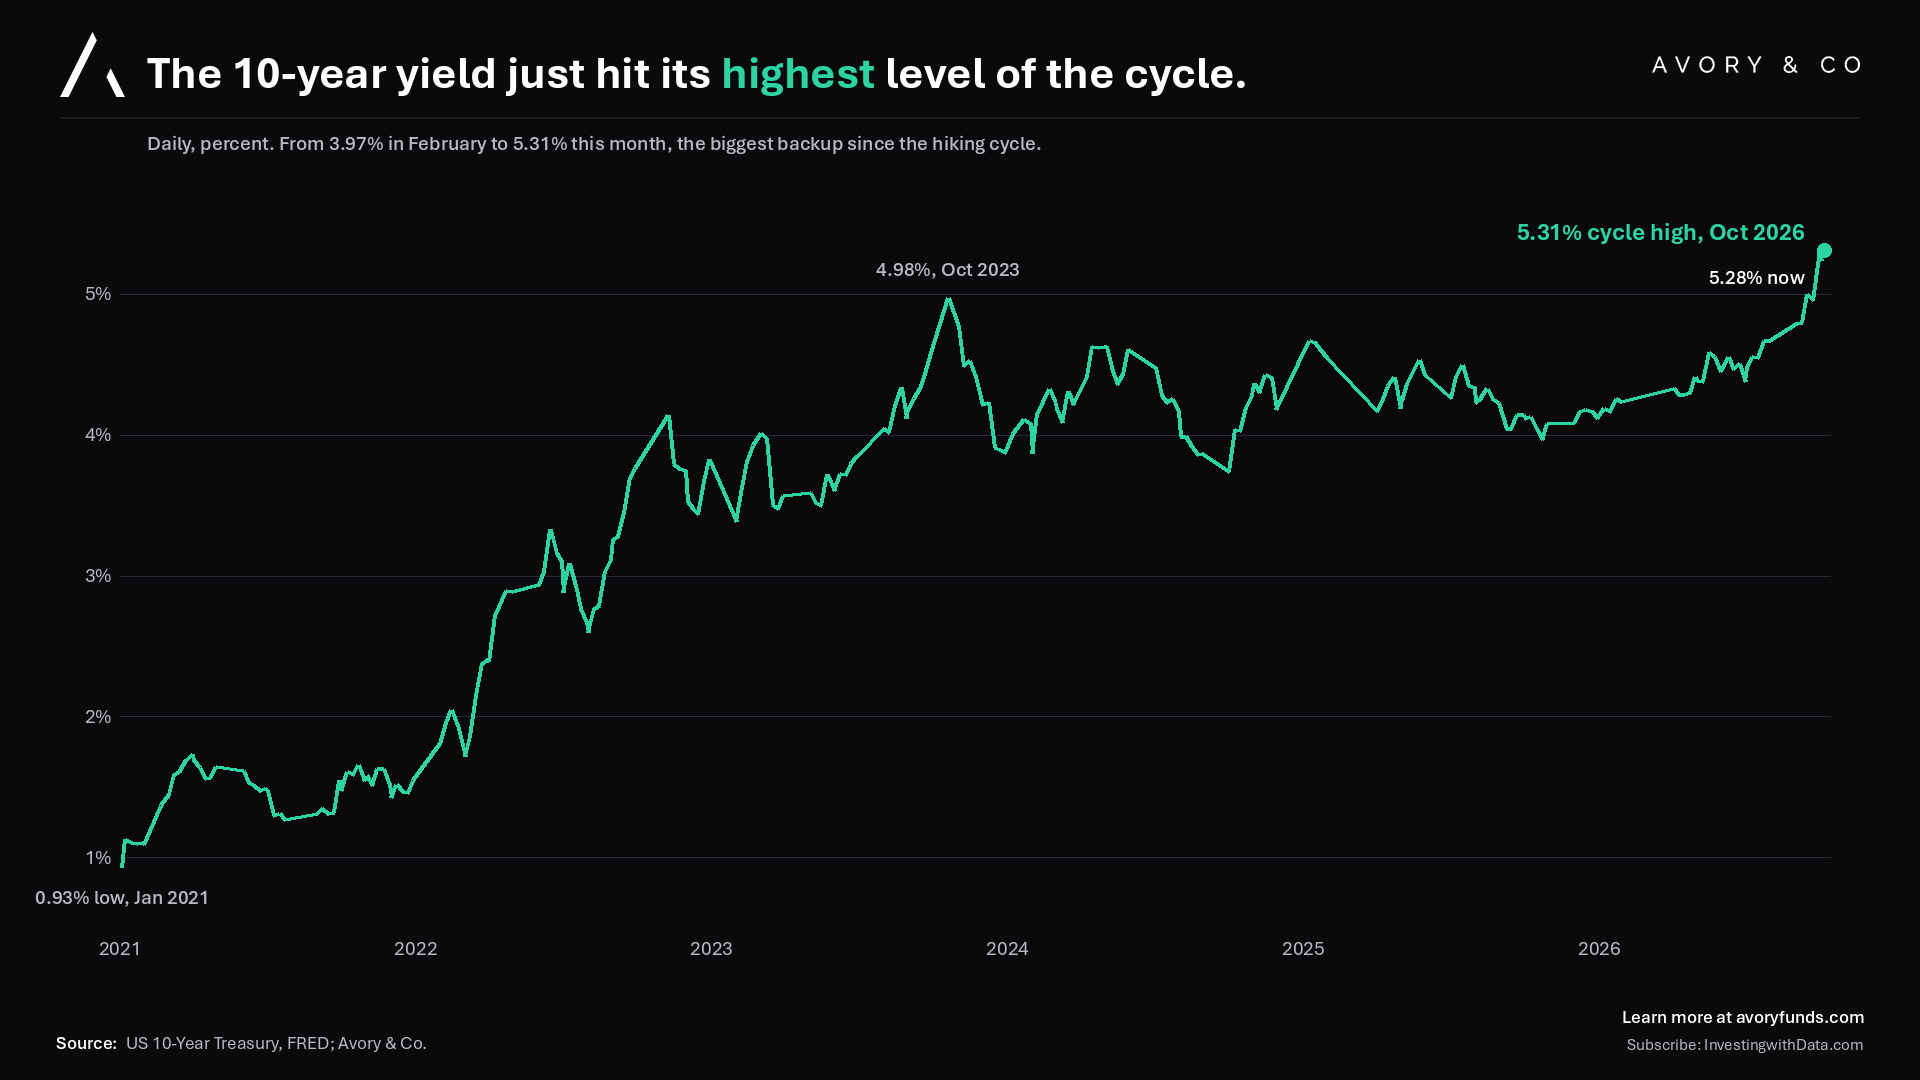
Some details here. The 10-year Treasury yield hit 5.31% this month, the highest level of the entire cycle, and above the 2023 peak everyone remembers as the moment the bond market had spoken. You will see below some data on this…
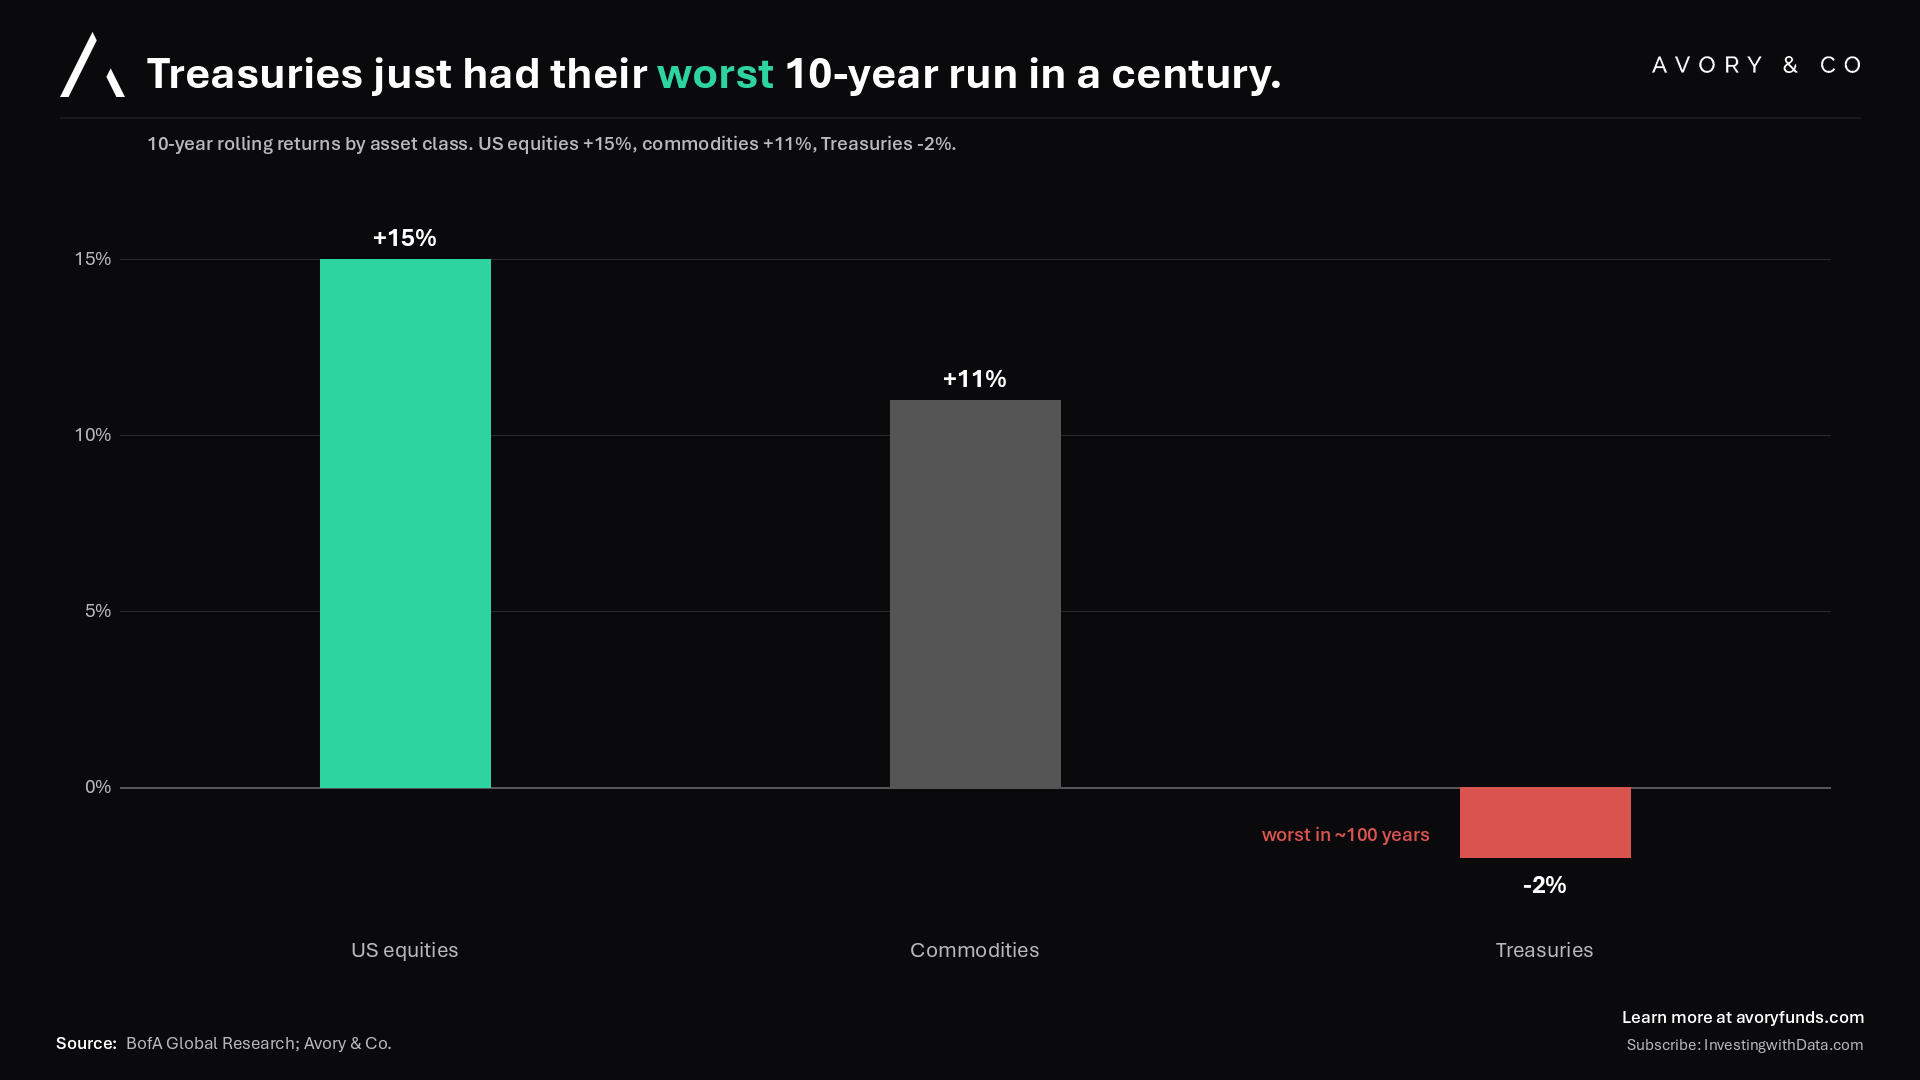
We know a couple of things. We have seen the worst 10-year run for Treasuries in about a century. Connected to a drawdown underneath the index that many were not aware of, and it sets up another rotation as we expressed 1-2 weeks back. Rate-sensitive sectors left trading well below their own average valuations. All sets up well.
Our view here at Avory is that the backup has likely run its course for now. Let’s get into the details and data!
[1] The 10-year yield hit a cycle high. But…
The 10-year hit 5.31% on October 5, the highest of the entire cycle going back to 2021, and above the 4.98% peak from October 2023. The move off the February low of 3.97% is the fastest backup since the hiking cycle itself.
But the Fed did not do this one in our view. Quite the opposite, when they cut rates, rates rose, and when they raised, rates stayed somewhat neutral.
The bigger influence is that the market is pricing a stronger economy and a bigger deficit at the same time. The deficit side of that equation is what the next chart underneath is about
[2] The US rolled its debt into higher rates.
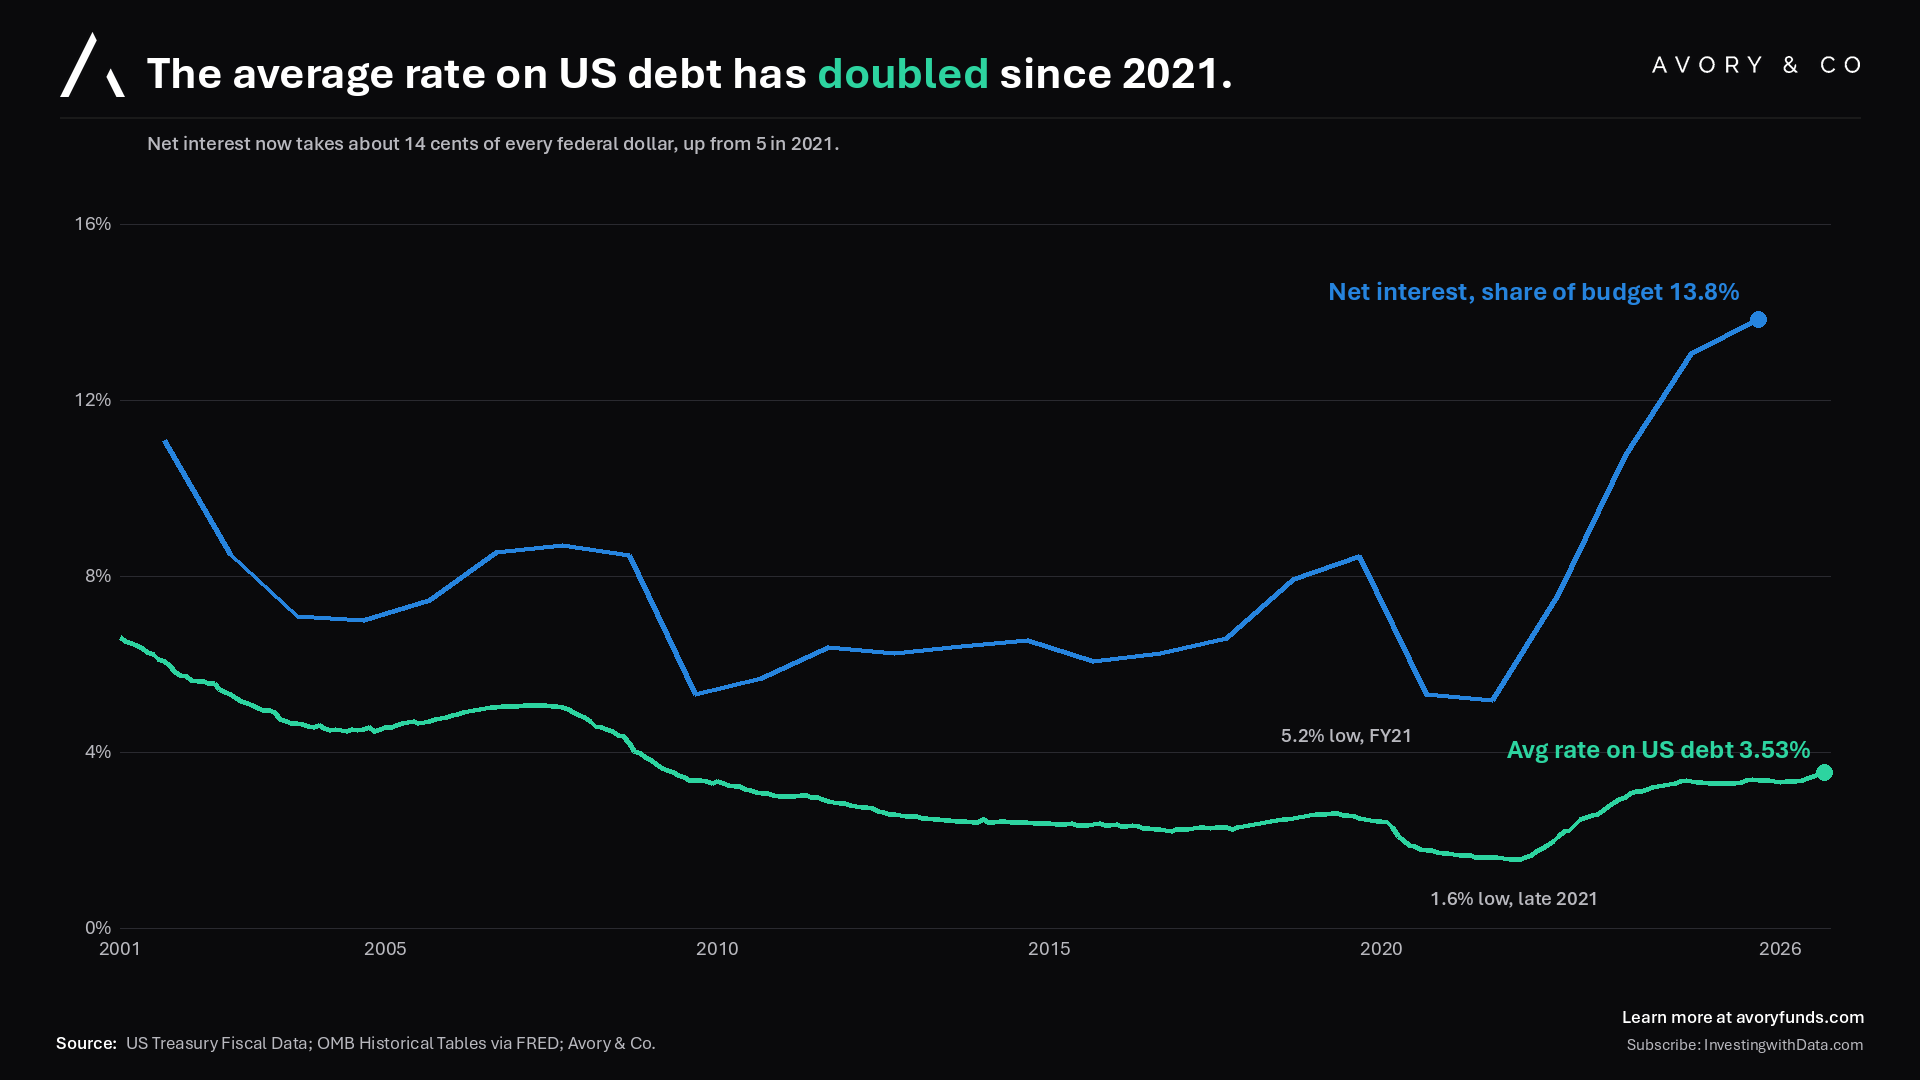
Here you can see the average interest rate on total interest-bearing US debt from Treasury Fiscal Data.
It bottomed around 1.6% in late 2021 and has more than doubled since, sitting at 3.53% as of September. Missed opportunity to lock in rates at these levels. Shame on the admin then.
The rise in rates now becomes a headwind to the budget. Which is why it is a risk, but also a known risk that should be viewed with the knowledge that the Fed and Treasury do not want this to rise too much more. Not because of economic activity or inflation, because of a budget. Because a bad budget can crowd out economic activity along with driving inflationary impulses.
So net interest used about 5 cents of every federal dollar in fiscal 2021, and in fiscal 2025 it took about 14 cents, or roughly $970B of interest on about $7T of outlays per OMB’s historical tables.
Worth noting fiscal 2026 just closed in September and those numbers are not published yet, so this series ends at FY2025.
As the green line moves higher, so does the blue, and both need to be resolved here soon
[3] Bonds just posted their worst 10-year run in a century.
This is critical and doesn’t signal a bottom or anything by itself. But the fact that real rates have risen, i.e. rates versus inflation expectations, means real income after inflation is coming in to buyers of bonds. Meaning likelihood for some buyer demand versus sellers.
Here’s the data.
10-year rolling returns on long Treasuries sit at -2%.
Historically the structural troughs were around 0% in 1959 and about 1-2% in 1981, so this is the worst run in roughly a century. You buy a bond for its yield, and when yields spend the next decade rising from the level you bought at, the total return math eventually goes negative. Again and obviously this does not mean yields have peaked, but it does mean the ‘bonds are uninvestable’ sentiment is likely improving.
[4] Under the surface, most stocks already had their drawdown.
Now switching from bonds to what this did to stocks.
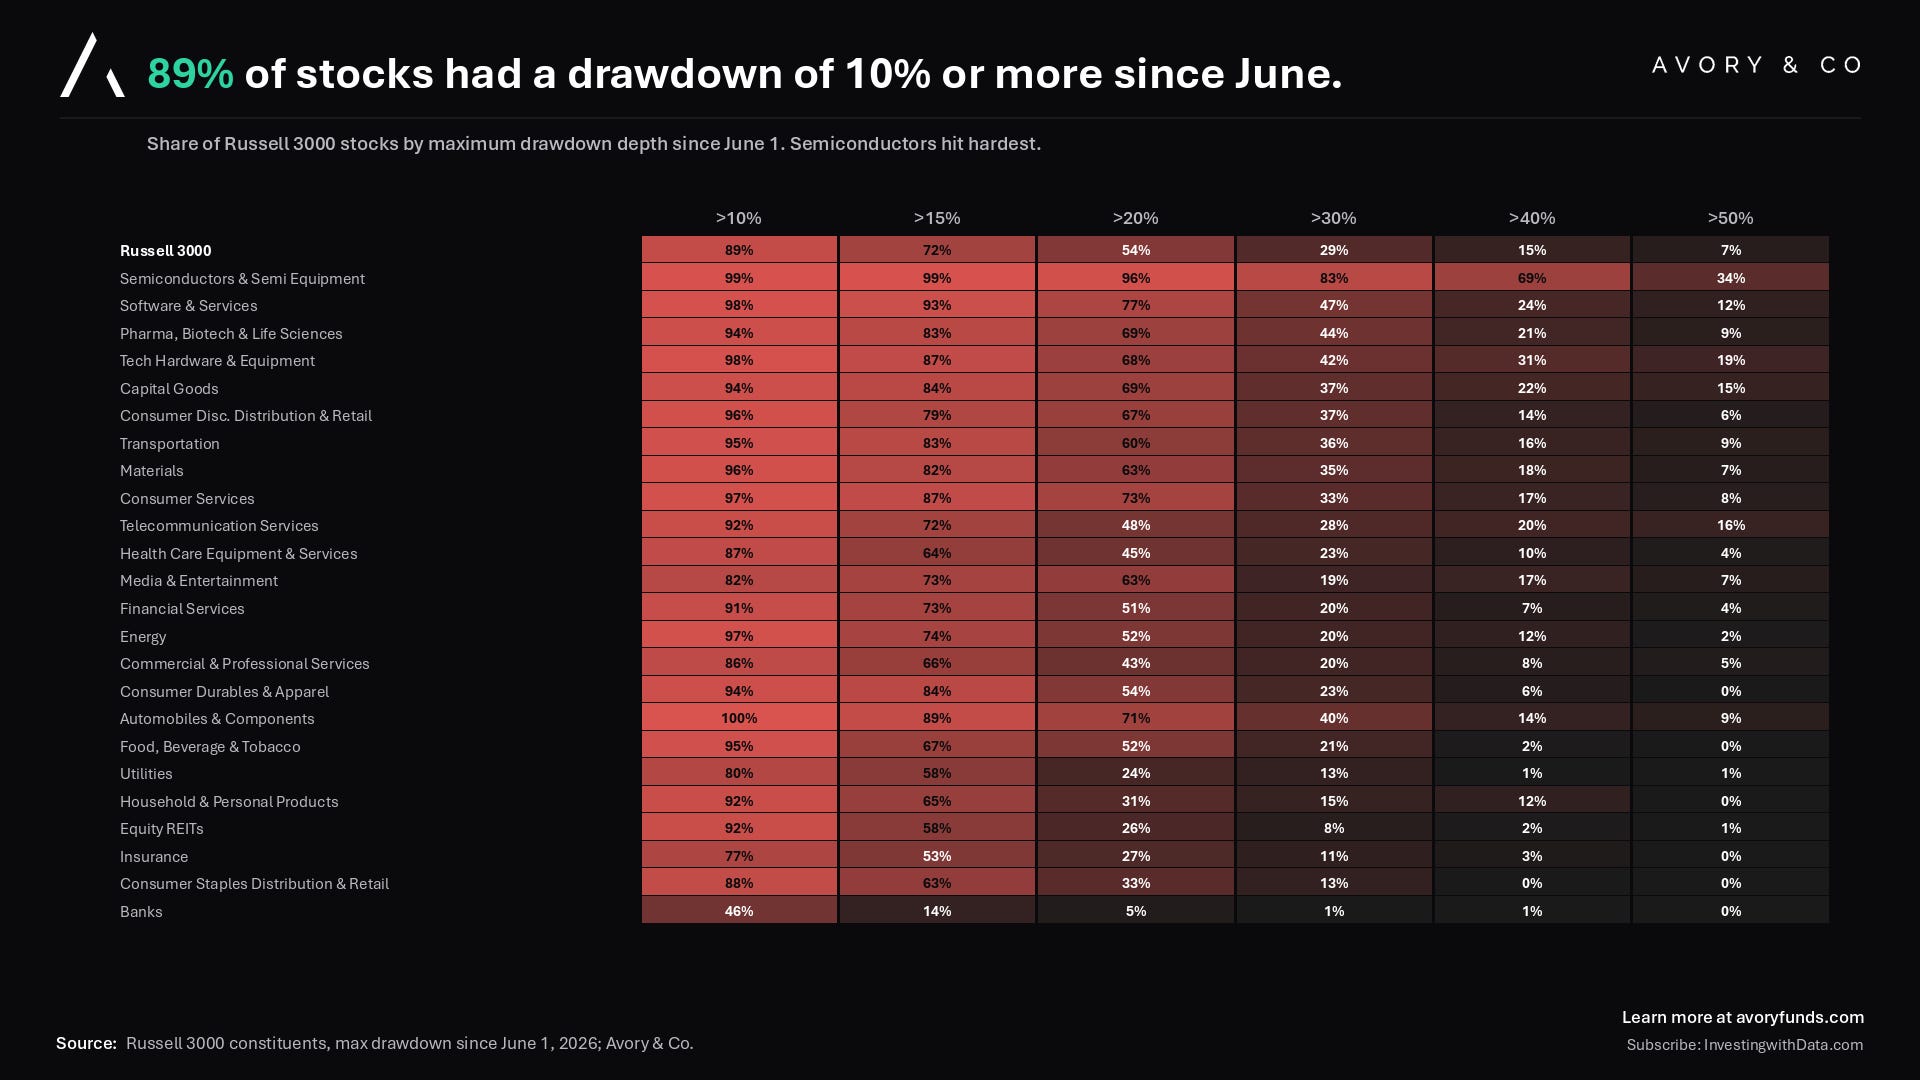
Since June 1,
89% of Russell 3000 stocks had a drawdown of 10% or more
54% had one of 20% or more, and
29% fell more than 30% at their worst point.
Semiconductors took it the hardest, with 83% of the group down more than 30% at the lows.
Banks barely participated, with only 46% of them down more than 10%, and utilities and REITs held up too.
…this is max drawdown, not where prices sit today. Some of these names have already bounced. But the message is that the index looked calm while most of the market had a real correction underneath it. That is actually good news as we sit here today
.
[5] Continued Opportunity… Rate-sensitive sectors are trading below their average valuations.
Now on the opportunity we have expressed here.
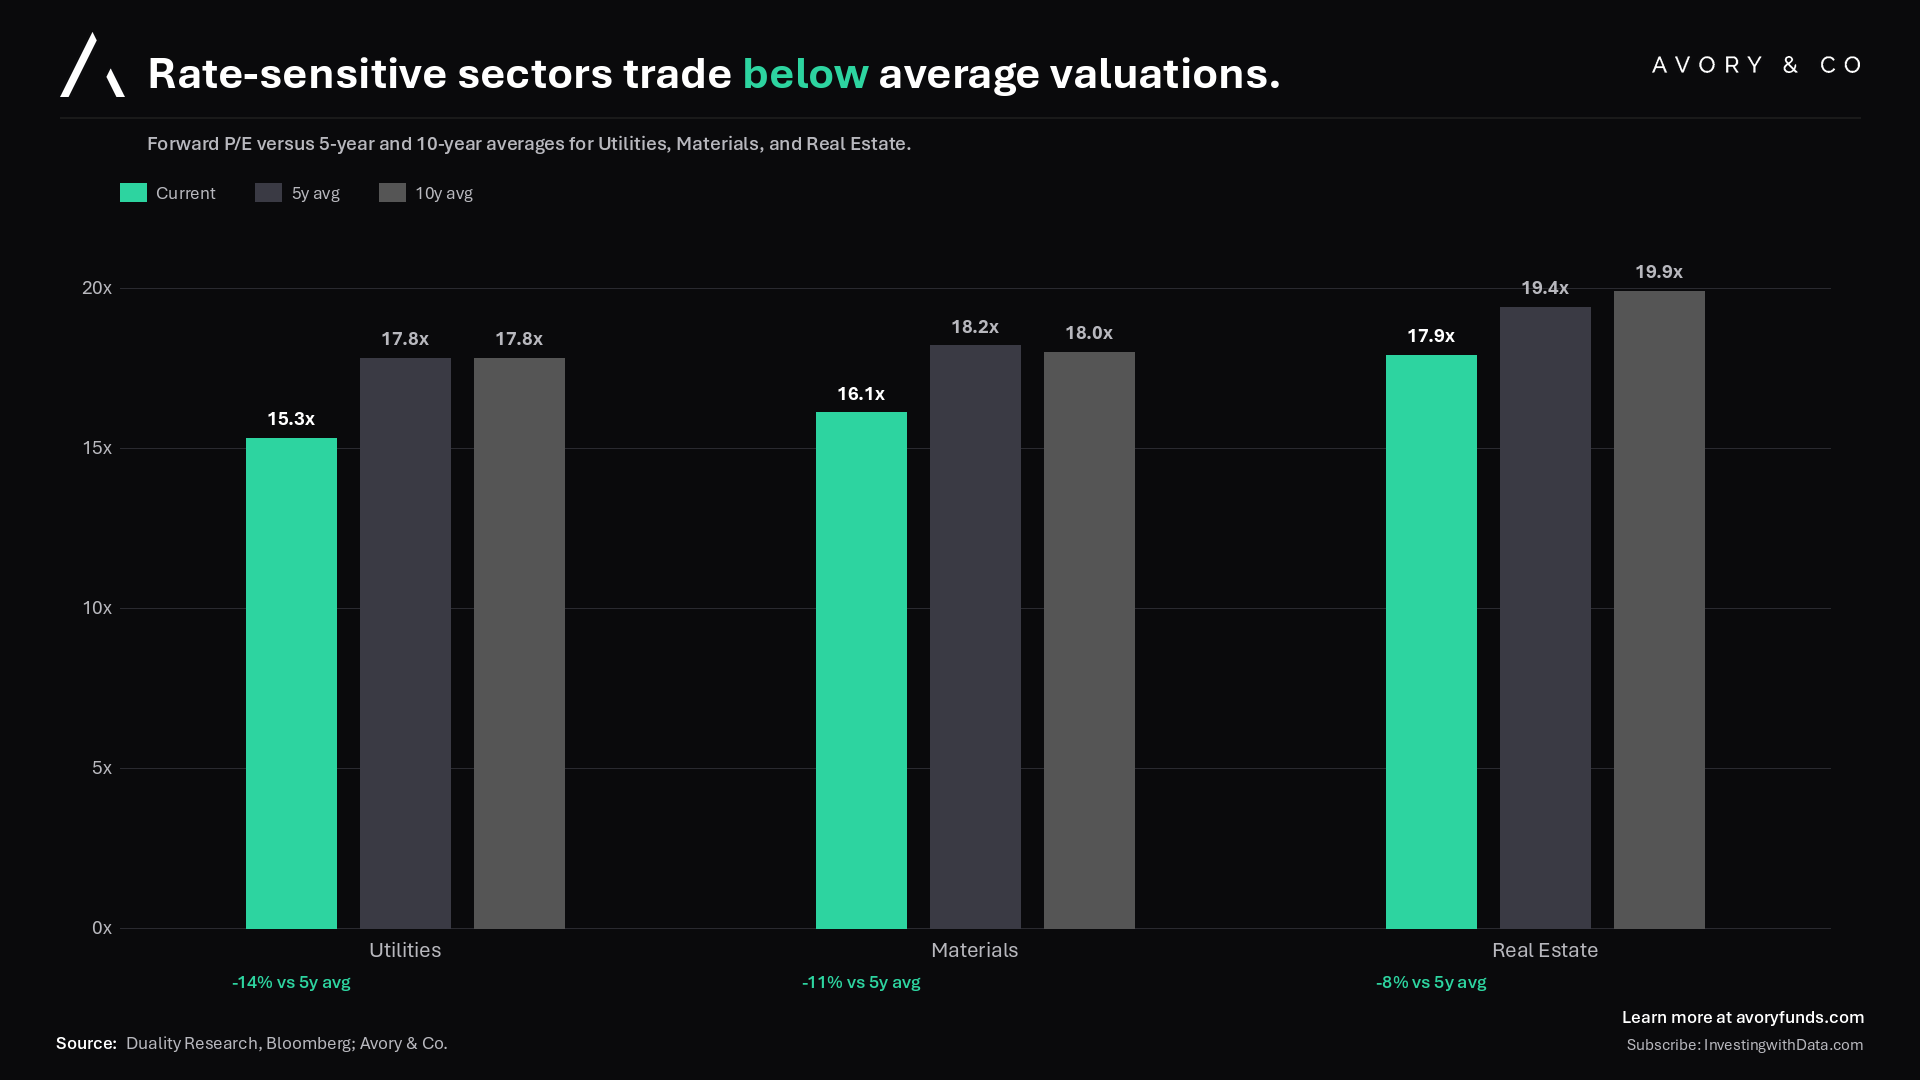
The sectors that get hit hardest by yields are very cheap now.
Utilities trade at 15.3x forward earnings versus a 17.8x five and ten-year average
Materials at 16.1x versus about 18x
and real estate at 17.9x versus a 19.4x five-year average.
All three sit well below their own history, and these are the parts of the market where the yield move has already done its max damage.
[6] When expansion drives rates, cyclicals win.
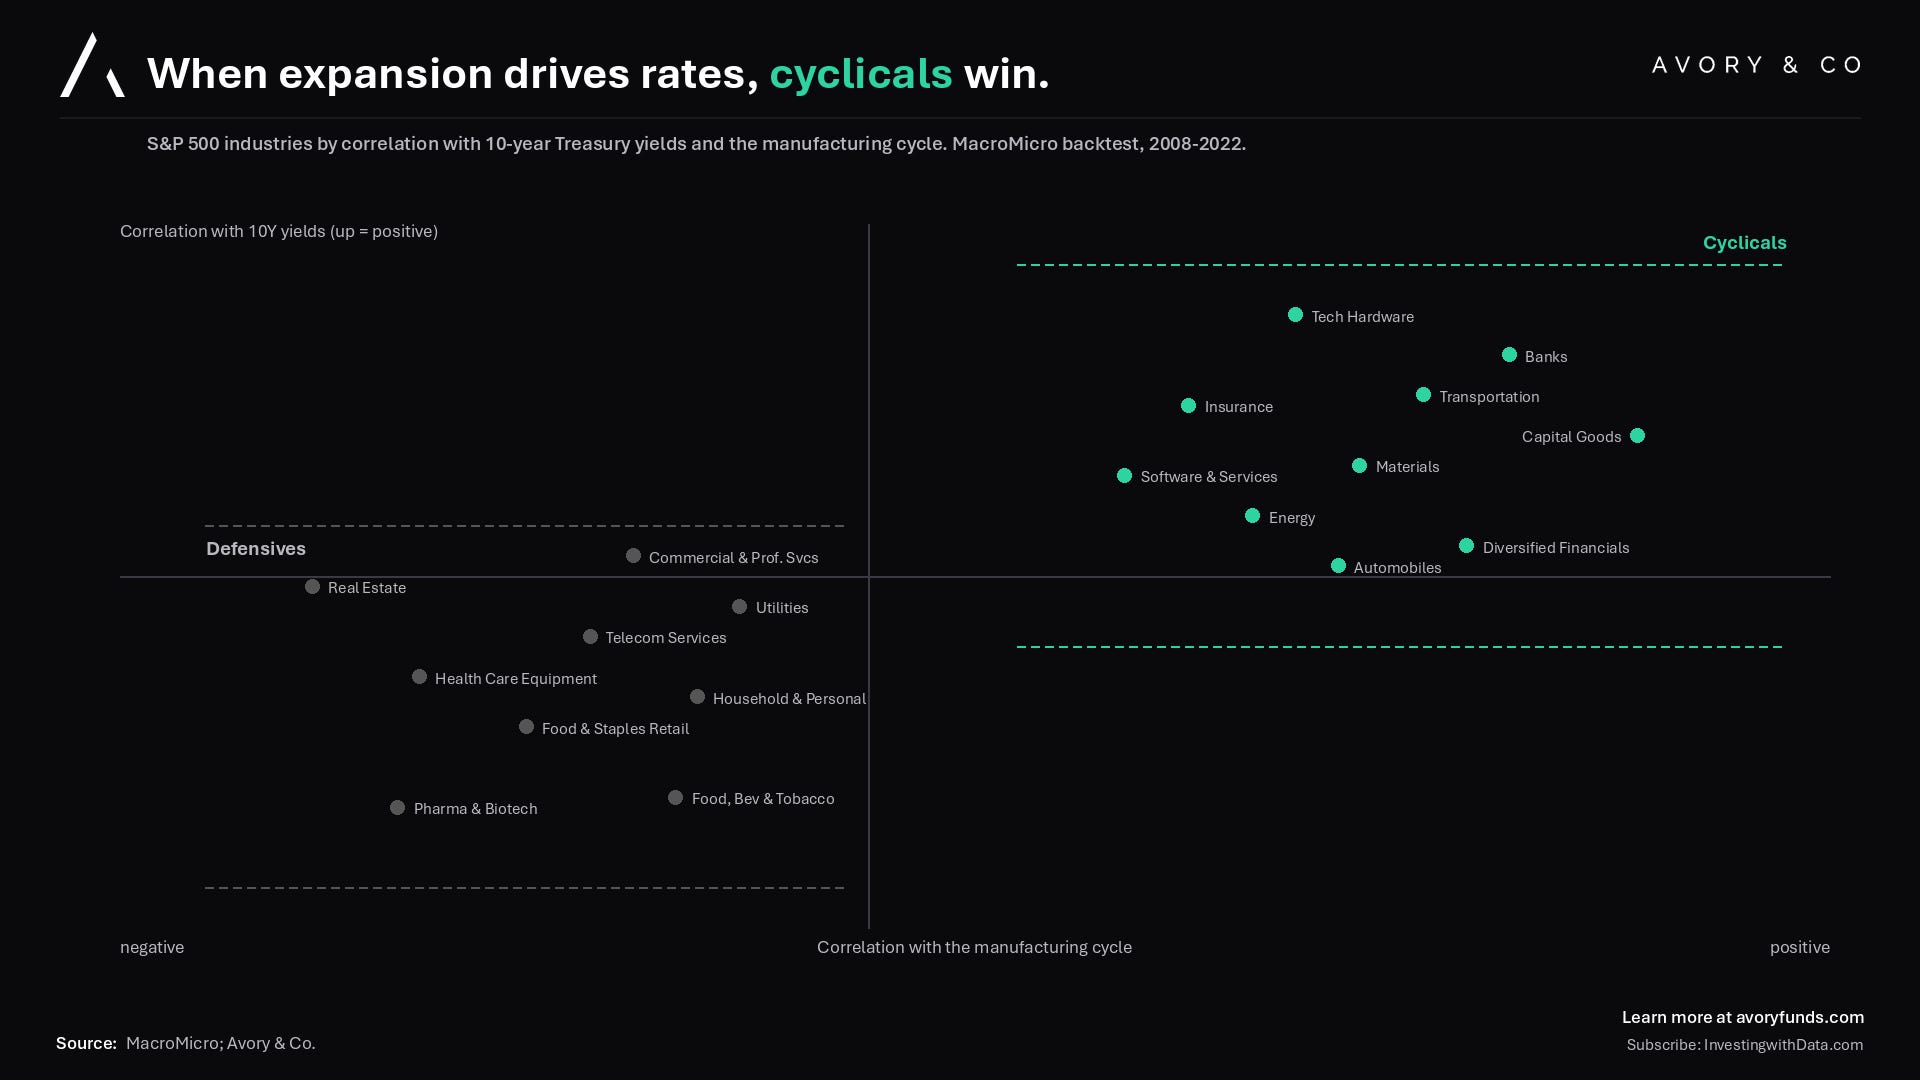
What is interesting is that when rates rise during economically positive periods, the outcome for the cyclicals I mention is positive.
When looking at the 2008-2022 backtest, the industries that correlate positively with rising 10-year yields are the same ones that correlate with the manufacturing cycle: banks, capital goods, transportation, materials, tech hardware. Defensives like pharma, telecom correlate negatively with both.
So if this yield move is being driven by expansion rather than distress, and that is our view, the market has already handed you the playbook…
[7] Middle East oil flows are almost back to normal.
Now we move to the inflationary / economic fear. Which is war and commodities.
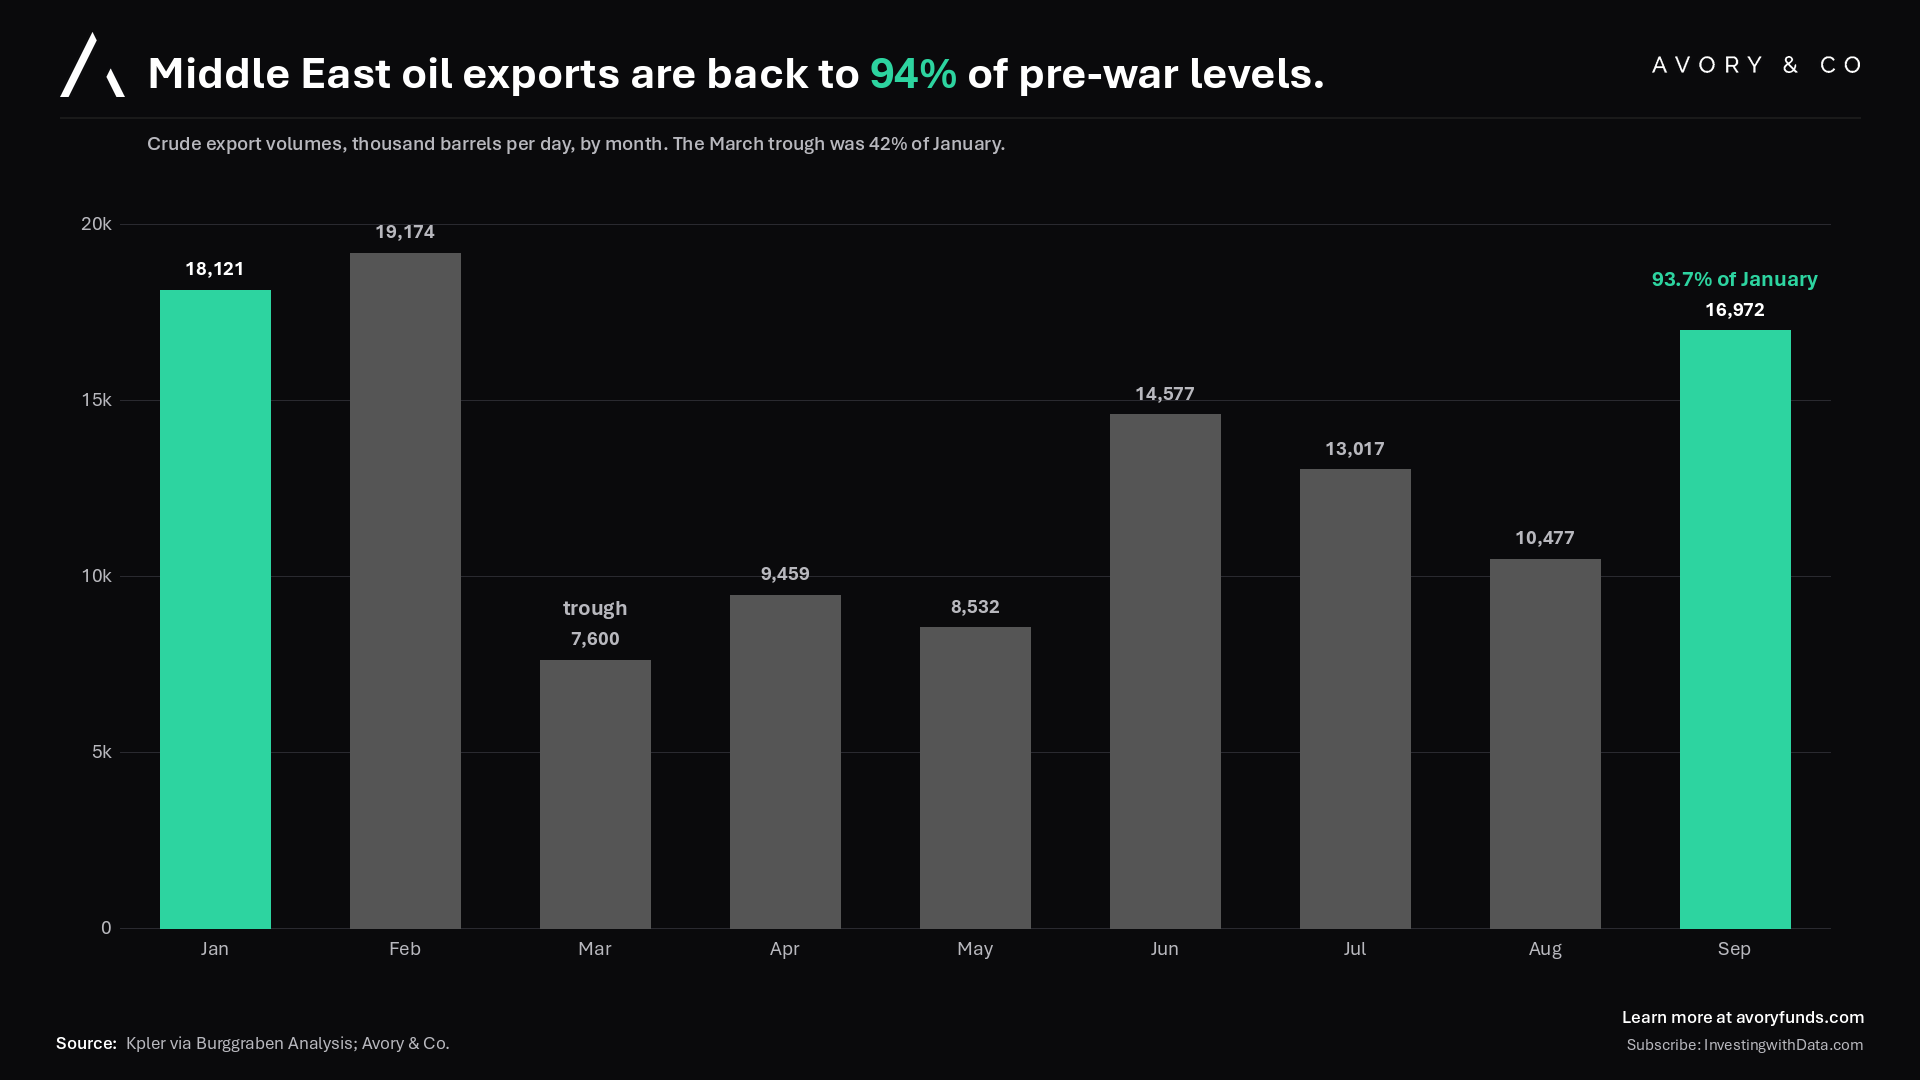
Data shows that the Middle East crude exports bottomed at about 42% of January levels in March and are back to 16,972 kbpd, roughly 94% of pre-war levels.
The interesting part is how. Hormuz itself is only back to about half its January volume, and the flows simply rerouted through Gulf of Oman ship to ship transfers, Fujairah, and the Red Sea.
The supply was dynamic it seems. We will keep following the story but that is where it sits right now…
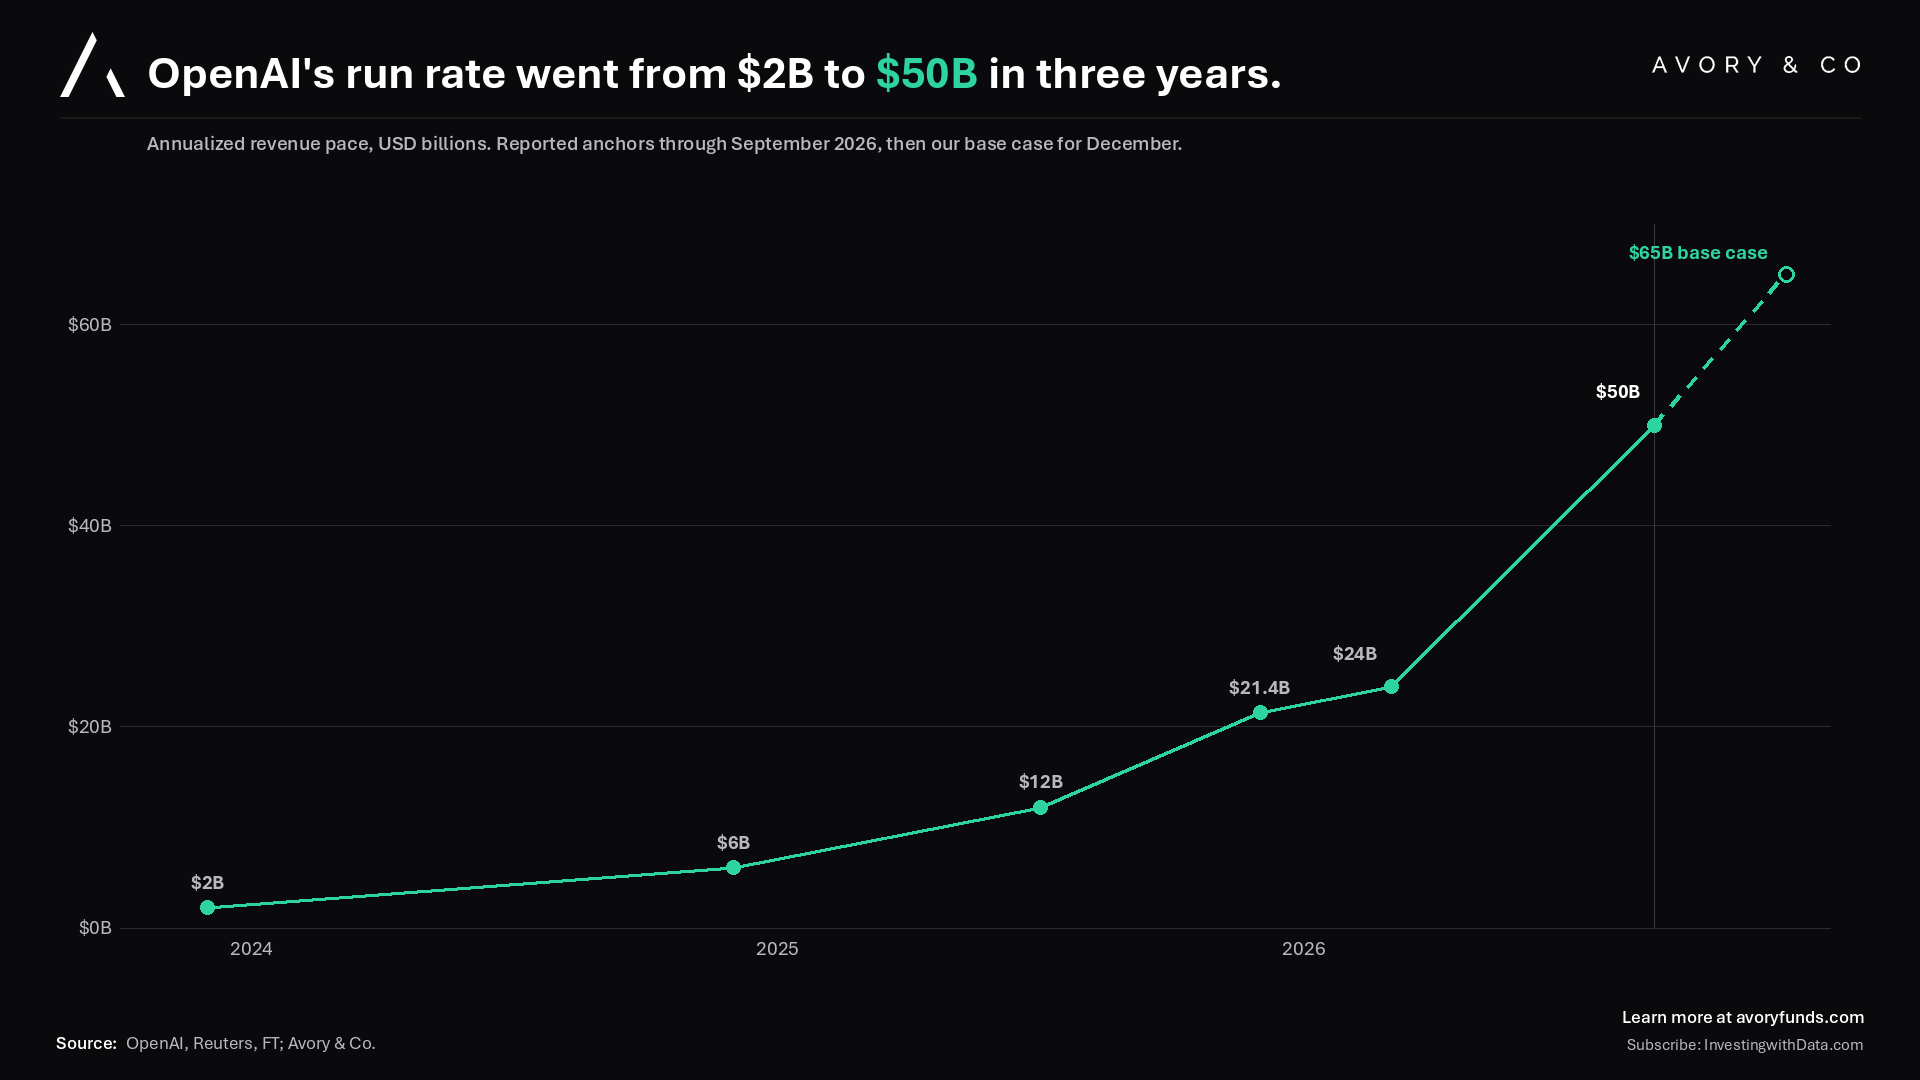
[8] OpenAI’s run rate went from $2B to $50B in three years.
Now switching to Open AI. This is a big one and we tried modeling out some numbers here.
Per the FT, their annualized revenue was approaching $50B at the end of September, up from $21.4B at year end 2025, $6B at the end of 2024, and $2B at the end of 2023.
On a recognized revenue basis, the leaked audited financials had them at $3.7B in 2024 and $13.07B in 2025, with $5.7B in Q1 and $6.7B in Q2 this year per The Information and the WSJ.
They then came out and said $70B by year end, since the market did not like their $50B run rate.
So if we draw revenue to year end to about $65-70B by December, on the $852B March financing mark that works out to about 17x the current pace. One thing to watch: the $70B figure making the rounds is an adjusted cloud-partner comparison, not the reported number, so make sure you know which one you’re quoting. Changes things, and honestly cannot wait for the S-1 for these companies…
[9] So then is this peak OpenAI growth rate?
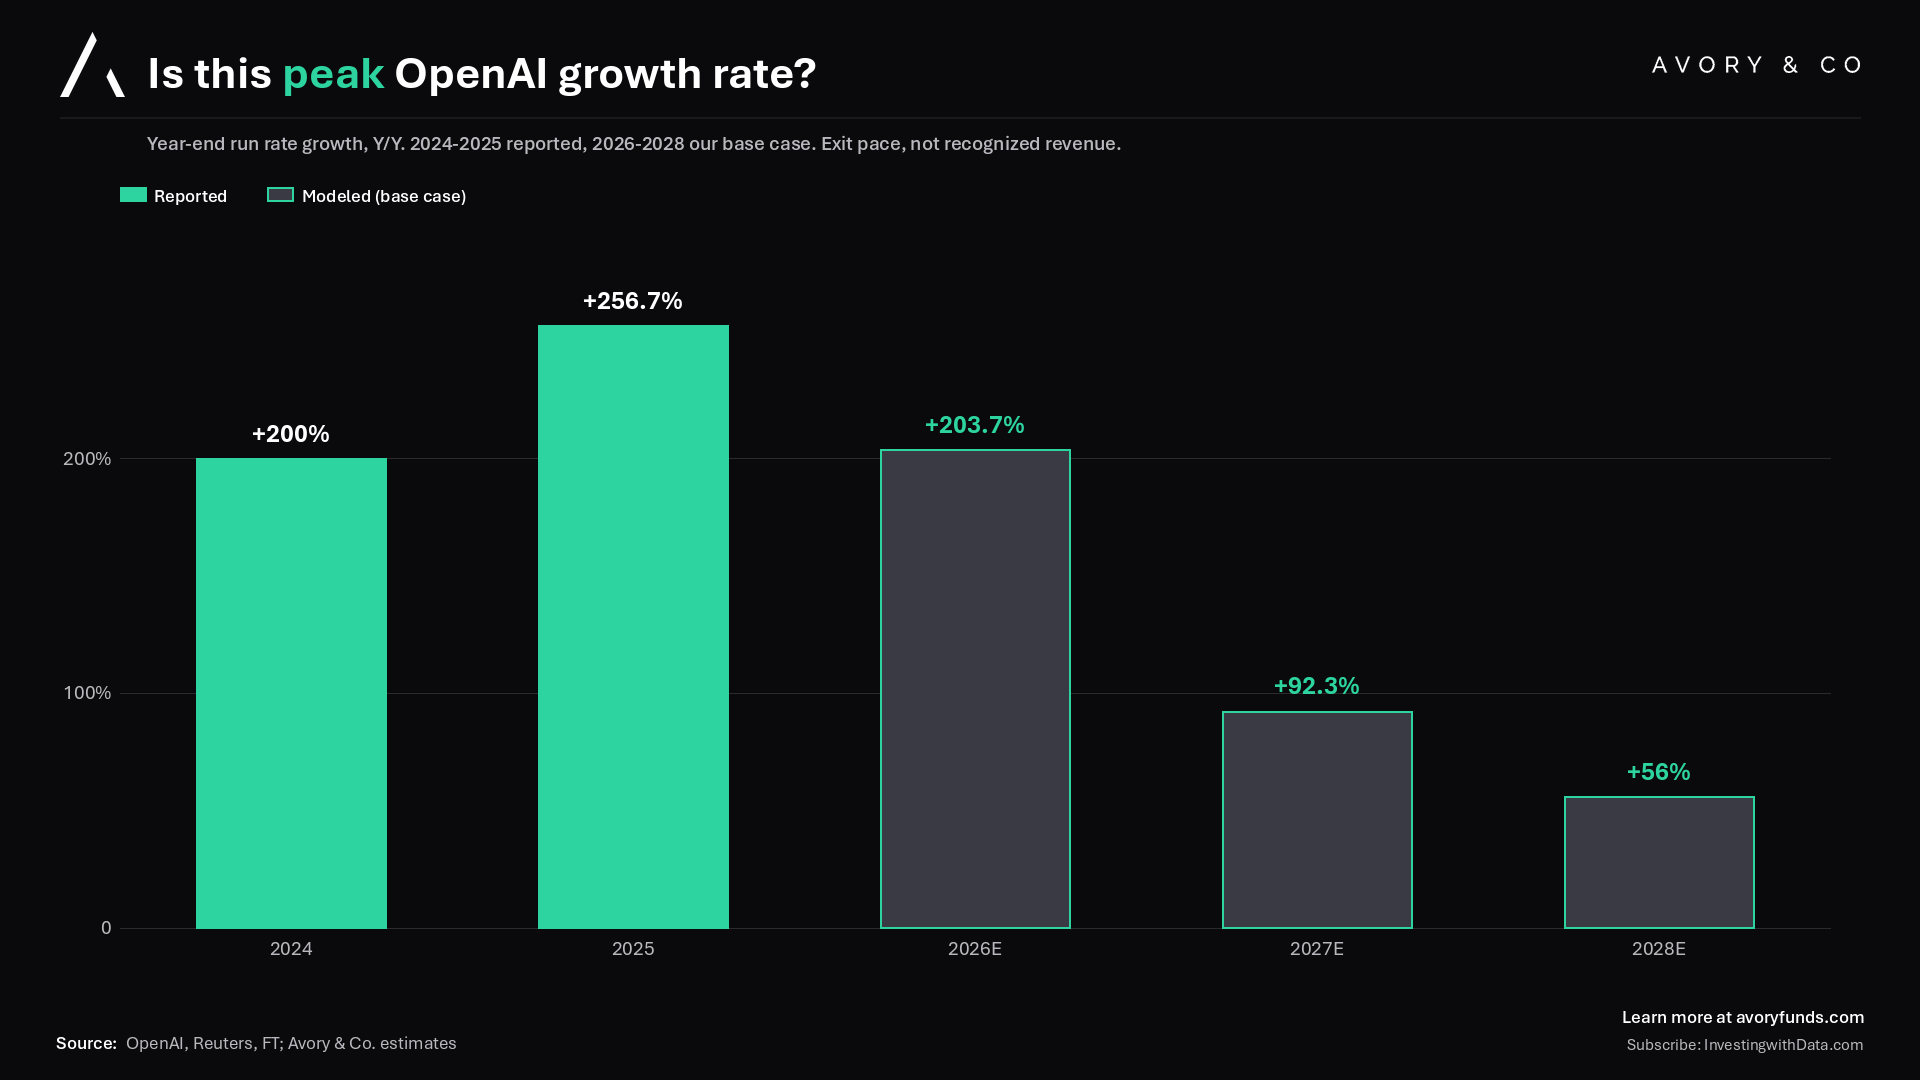
So we model that trajectory and we get what???
Run rate growth peaked at 256.7% in 2025, and our base case steps it down to 203.7% this year, 92.3% in 2027, and 56% by 2028. We have no foresight here, just trying to regress the numbers that are somewhat known.
On the current trajectory, this is peak rate of change for OpenAI, for now, and on a base that is now enormous. To be clear, that does not mean peak AI for the entire space, and we still have breakaway stories like Muse increasing usage over there. Also none of this means OpenAI stops executing well, it is just the math of the high base, and it is why the leaked 2030 plan of $350B of revenue requires everything to keep going right, and ALSO why the roughly $278B of cumulative burn that came with it is already being disputed inside the company. It is tough but if this is the outcome, then lots to think about and why the market maybe did not like it.
[10] OpenAI’s quarterly revenue is still accelerating.
More numbers on it to tie the bow.
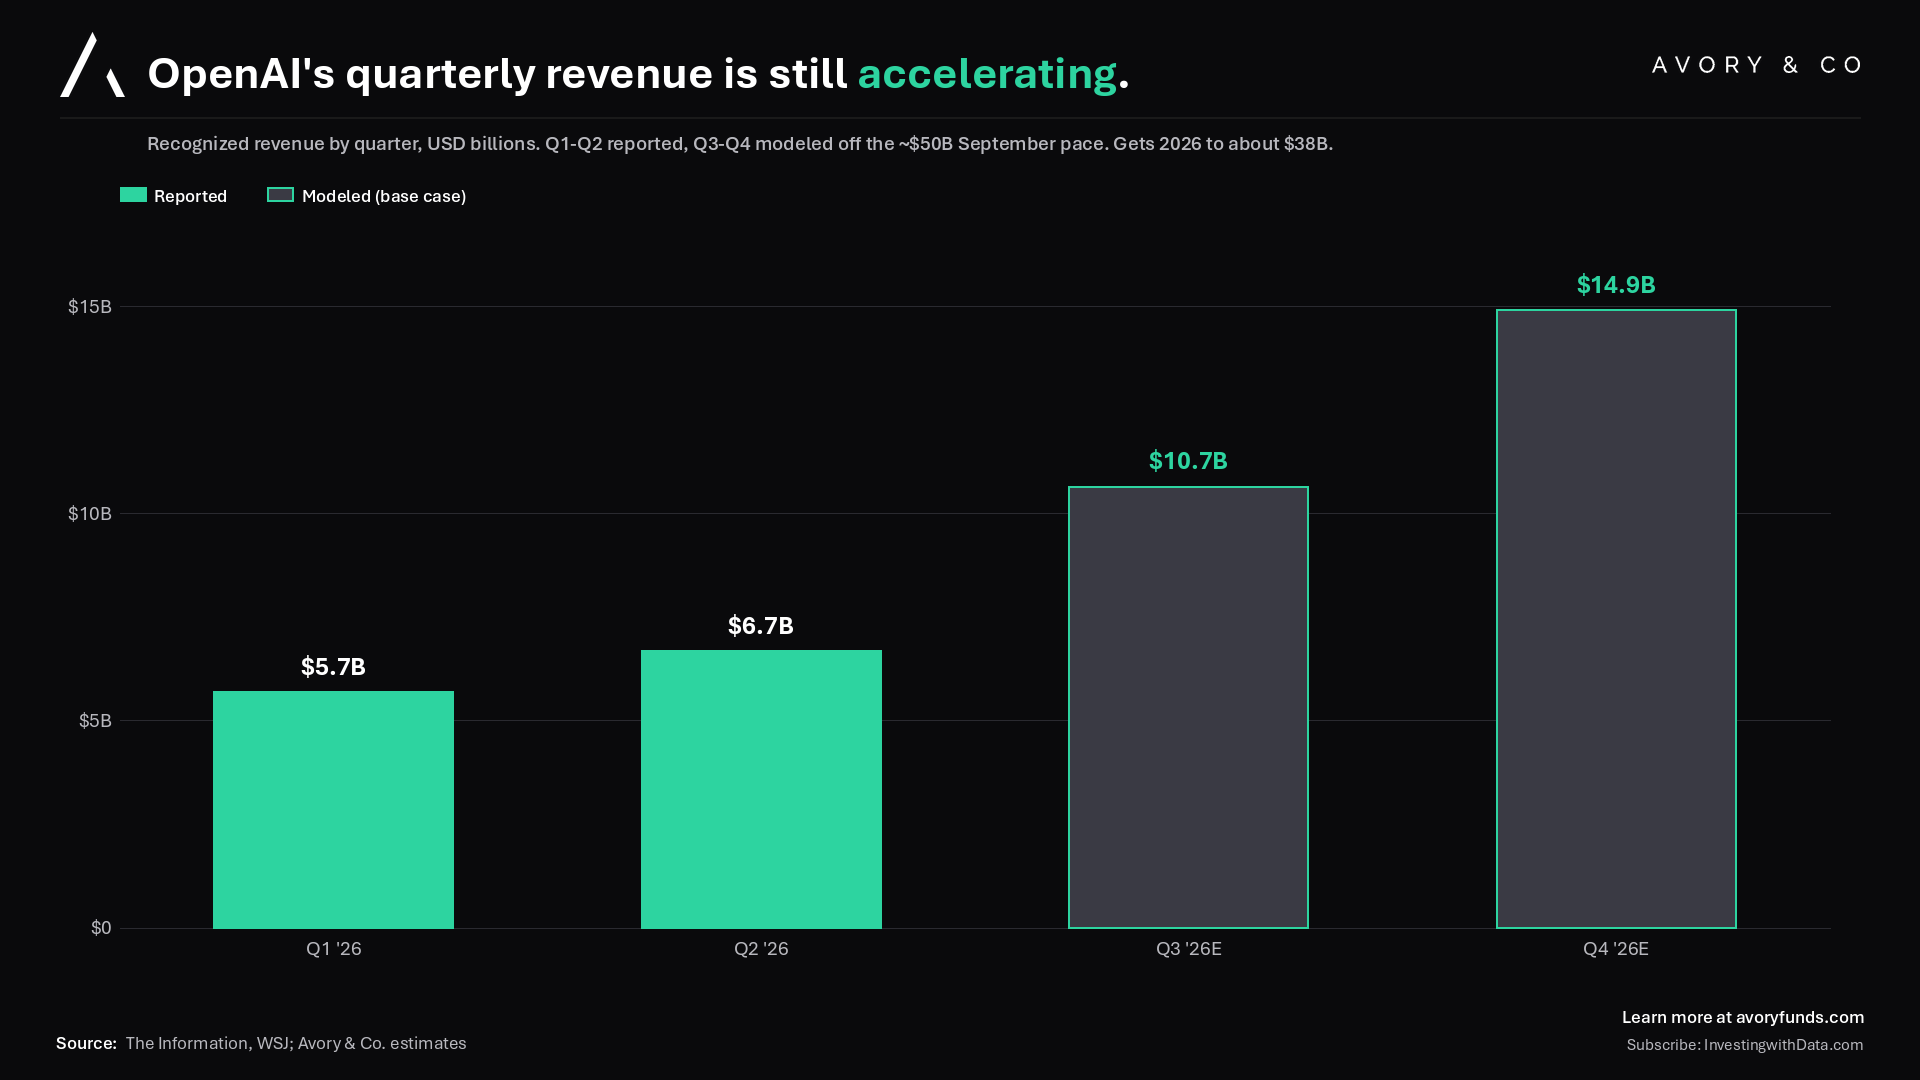
Q1 came in at $5.7B and Q2 at $6.7B, both reported per The Information and the WSJ.
Q3 and Q4 are our model built off the ~$50B September pace, which gets 2026 to about $38B of recognized revenue, a touch above the $36B internal projection that leaked in September.
So even in our base case they’re running ahead of their own plan. The only thing is the quarter to quarter step up is flattening.
Net Net
Our read: the yield backup has done its work for now. Real rates rising on demand is a strength signal, not a distress one, and the deficit fear trade is crowding an economy that keeps refusing to slow. So we think rates stabilize from here, which sets up the rotation we shared back in May and June: cyclicals do better, the non-AI trade gets a lift, and the value areas we predominately own finally get their turn. All things we have pointed to for months, and it has been the correct view for now.
On AI, this week’s numbers are a good reminder that all of AI should not trade as one trade. OpenAI looks like peak rate of change on a base that is now enormous, but that does not mean peak AI for the entire space, and we still have breakaway stories like Muse compounding on their own curve. We are investors, not traders, so we stay close to the trades without reacting to the moves unless something fundamentally changes. Nothing this week changed that, forsure.
That’s all for this week!
About Avory & Co.
Investing Forward.
www.avory.xyz / www.avoryfunds.com
Avory specializes in high-conviction equity strategies, emphasizing Secular Growth and Transformation Stories driven by exceptional teams. Data guides decisions. We cater to high net worth investors, family offices, and institutional investors. Note: This information doesn’t constitute a recommendation to buy or sell any mentioned securities. Avory is based in Miami, Florida with clients all across the globe.
Speak to us:
Send us an email: Team@avoryco.com
Want to invest? We are on most platforms.
Want More
🎥 Avory YouTube: Channel
🎙️ Avory: Podcast
Disclaimer: Not a recommendation to purchase or sell any securities mentioned. This is for educational purposes only.