

Big Picture
💡 This feels like 1997-1998, SEE BELOW… BUT Fear spiked hard this week. Here's why we think it looks more like a reset of who wins in AI than the start of something bigger, and what the data says about the path from here.
Quick one before we get into it. Later today I’ll be live from the Cboe floor on Schwab TV at 10:40 AM ET, talking markets, AI, payrolls and more, so stay tuned.
Watch on YouTube: Schwab Network Live
Watch on Schwab Network: schwabnetwork.com

Now to the market.
Yesterday I was on the VIX trading floor as the VIX jumped 68% in a single day, the 3rd largest one-day spike since 1990, and Nvidia fell 9.3% (it’s now down 24% from its October high). The good news is moves like this have generally been more constructive signals than not, and I will try my best to use data to inform us…
We’ve been talking about rotation for a while now, and we warned that the AI trade had gotten way too broad, with a lot of companies moving higher that didn’t warrant it.
Our message was get off that train as it was was very consensus, there were warning shots of open models, and we’re still in 2026, so hopefully you took that warning. We’ve stayed away from most of it. We have some direct exposure and some smaller second-order exposure, and we sold Okta weeks back when things were getting way too optimistic in Ai agent land.
And to be clear we want to own some of these things but not overwhelmingly and the key is just know why you own and why, and your investment days will be less stressful as one the main risk is the risk of unknown and we have shared a stat recently on how the avg investor is spending 6 min before they make a trade.
That’s not us and that should not be you.
To be very clear, we don’t think the AI trade is over. It’s just getting more specific. When the leader of the group gets hit as hard as Nvidia did, that shows up in correlations, and that’s what took down other parts of the market beyond AI. So this feels more like a reset of what will win in AI and what won’t, and that’s a good thing.
We are investors, not traders. Lets get into the details and data!
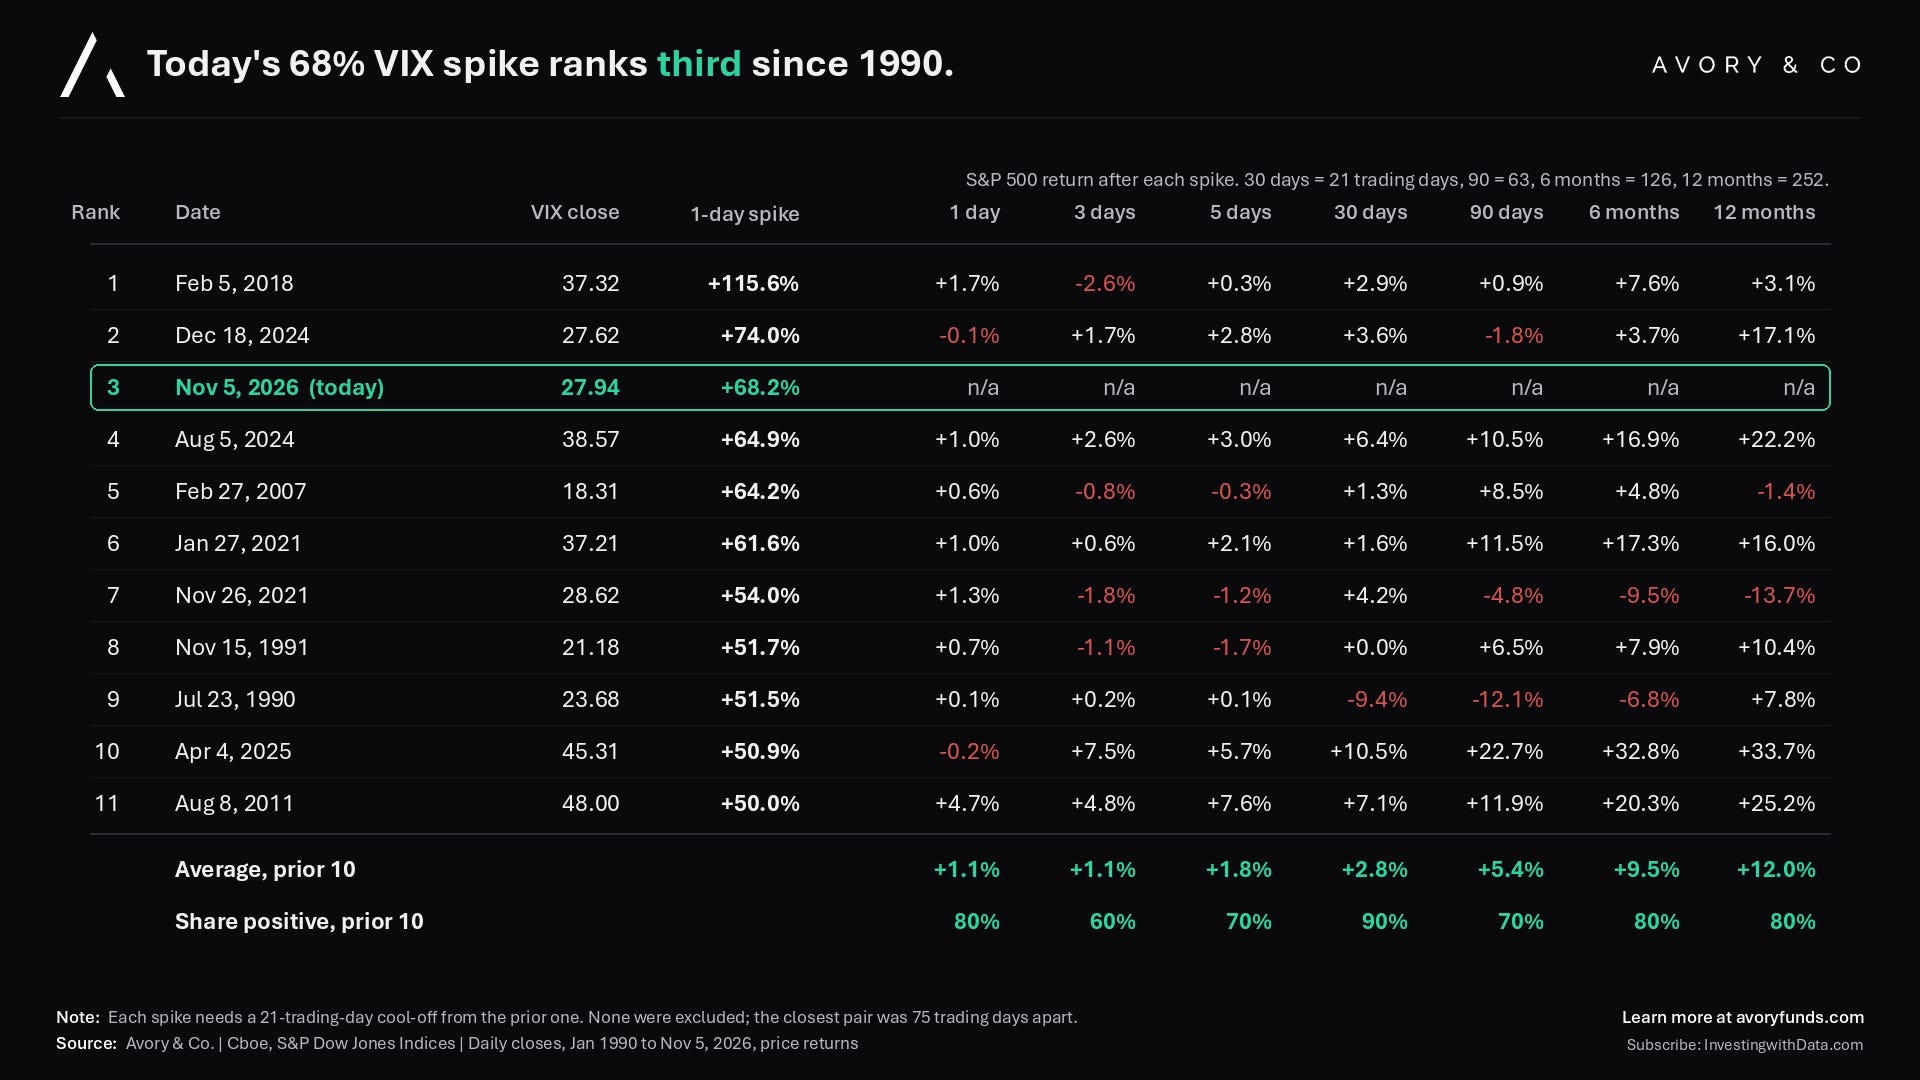
[1] Yesterday’s 68% VIX spike ranks third since 1990.
The VIX closed around 28 after a 68% one-day jump, behind only February 2018 (+115.6%) and December 2024 (+74.0%).¹
The prior 10 spikes like this saw the S&P 500 higher 80% of the time a year later, with an average gain of +12.0%. You can see what that path looked like on the next chart.
[2] The S&P 500 averaged +12.0% in the year after 50% VIX spikes.
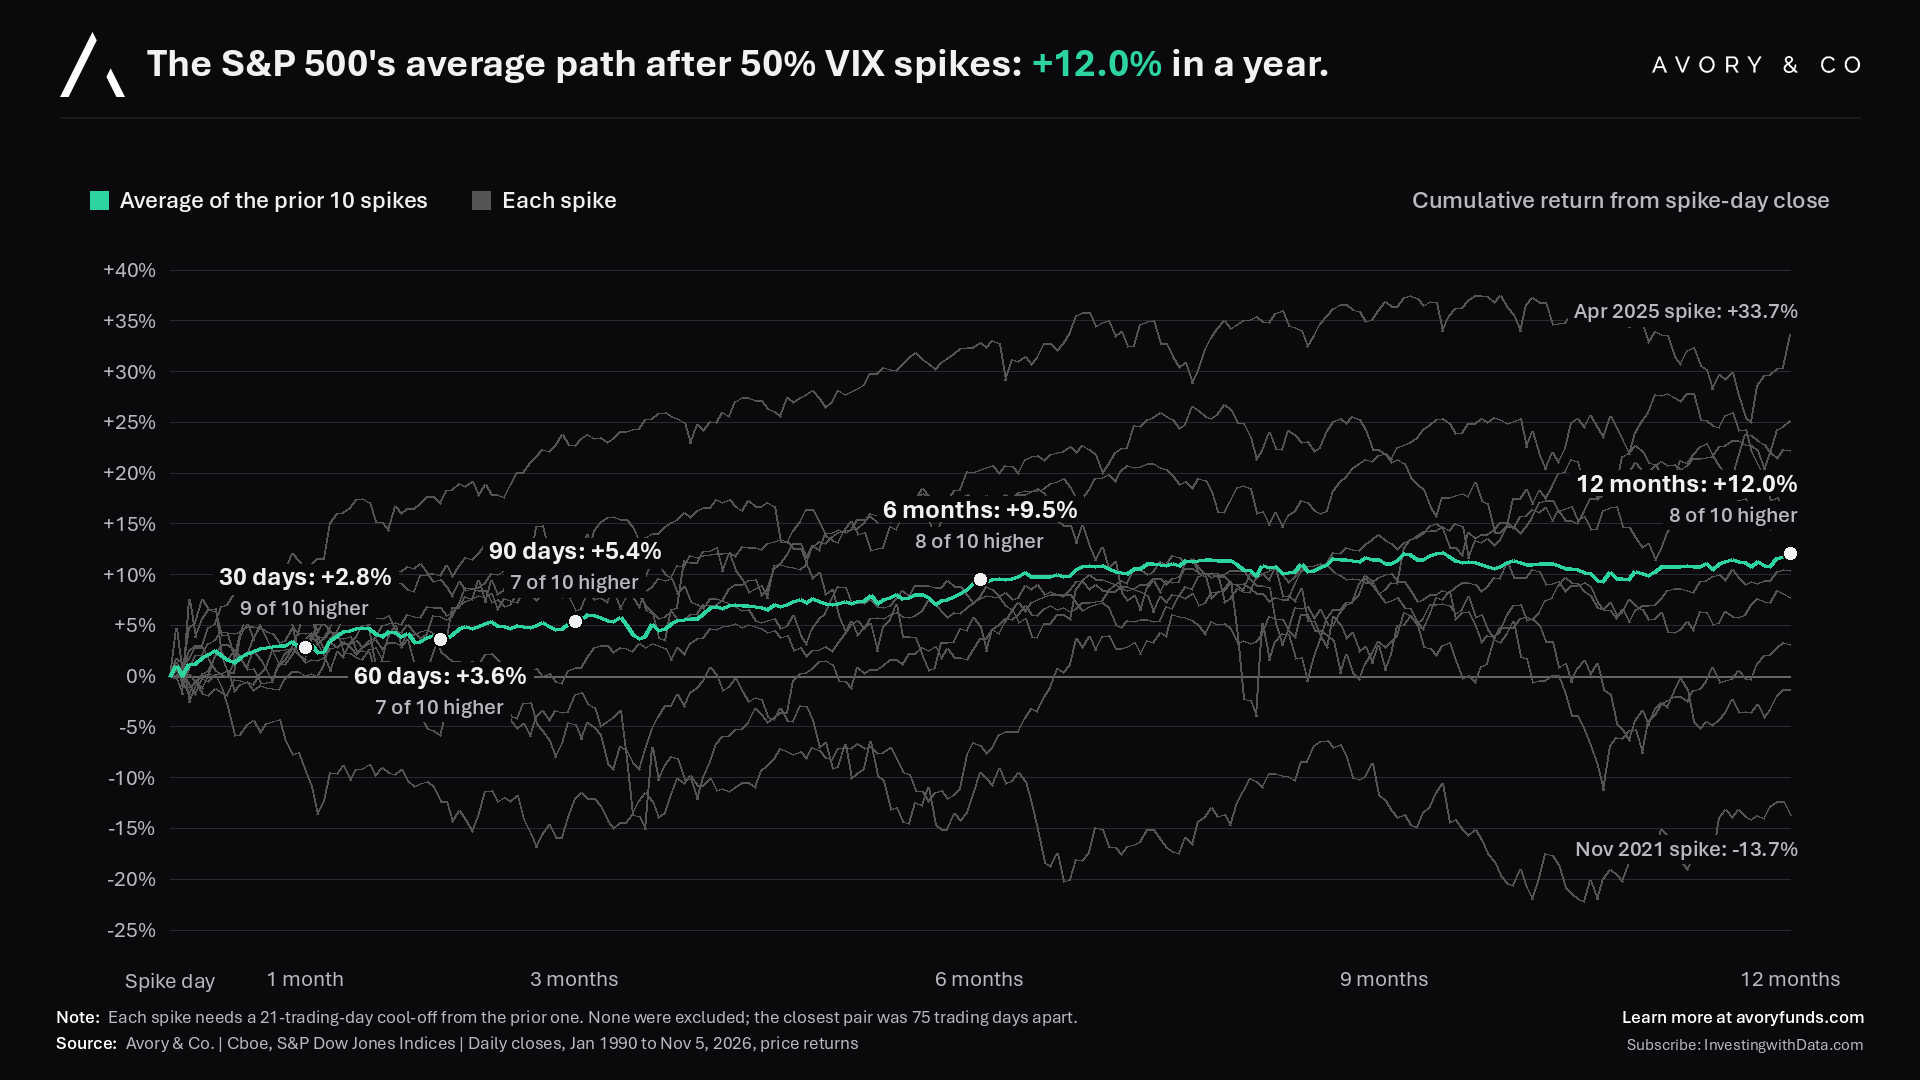
Here’s the average path for the S&P 500 after the prior 10 spikes of 50% or more:
+2.8% after 30 days (9 of 10 higher)
+5.4% after 90 days (7 of 10 higher)
+9.5% after 6 months (8 of 10 higher)
+12.0% after 12 months (8 of 10 higher)
The spread is wide though.
The April 2025 spike was followed by +33.7%, and the November 2021 spike by -13.7% (that one ran right into the 2022 rate hiking cycle).
History says fear spikes like this have been better entry points than exit points, but not every time.
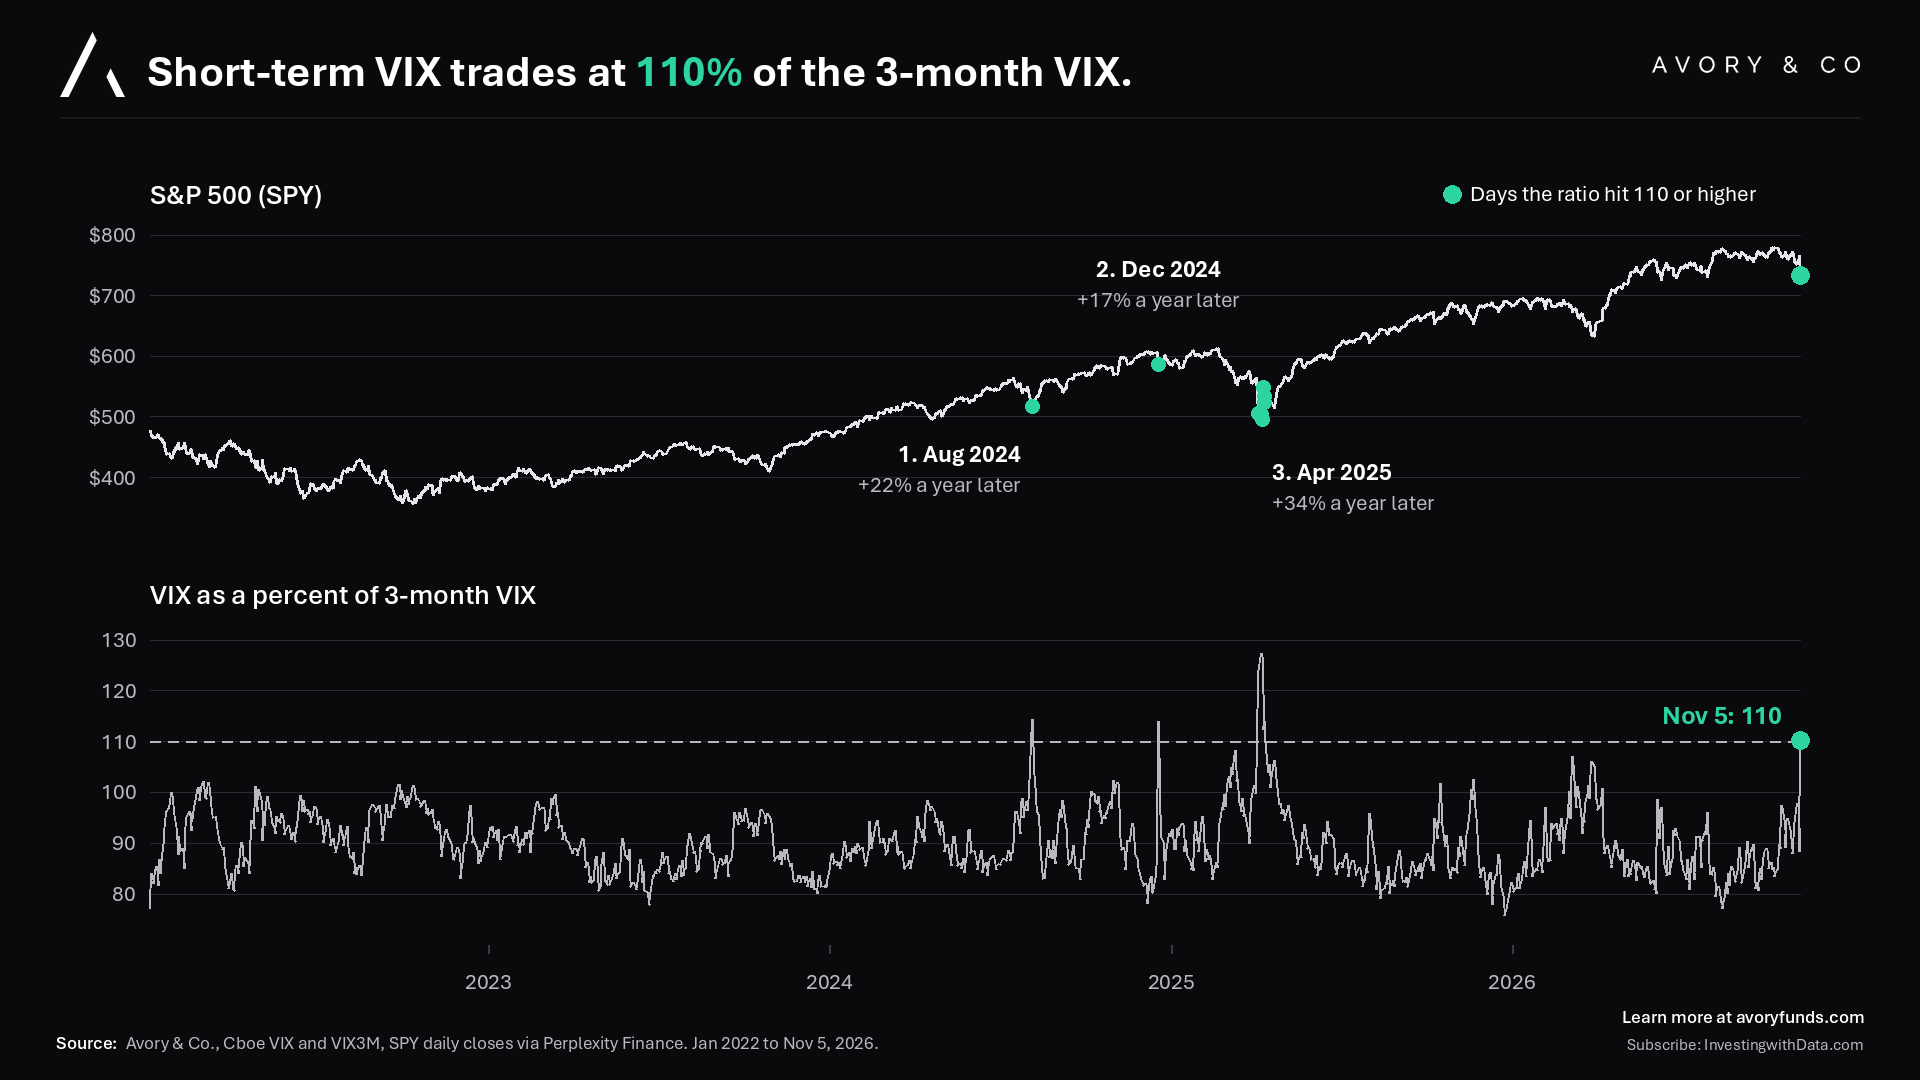
[3] Short-term VIX trades at 110% of the 3-month VIX.
When near-term volatility trades above 3-month volatility, the curve is inverted, and that usually means the fear is about right now, not the next few months. The ratio closed at 110. Since 2022 it’s only been this high three other times:
1. August 2024, SPY up 22% a year later
2. December 2024, SPY up 17% a year later
3. April 2025, SPY up 34% a year later
Now look at 1, 2 and 3 on the chart. The path forward can be choppy (after December 2024 you still had to sit through the April 2025 selloff), but the path forward tended to be fine even with the scare.
In many ways this looks like 1997 and 1998 to us.
You had VIX spikes back then (the Asian crisis in 1997, Russia and LTCM in 1998), and the Fed cut rates three times in the fall of 1998, even though there were still about two years left in the internet trade (the Nasdaq didn’t peak until March 2000).
The leaders changed along the way.
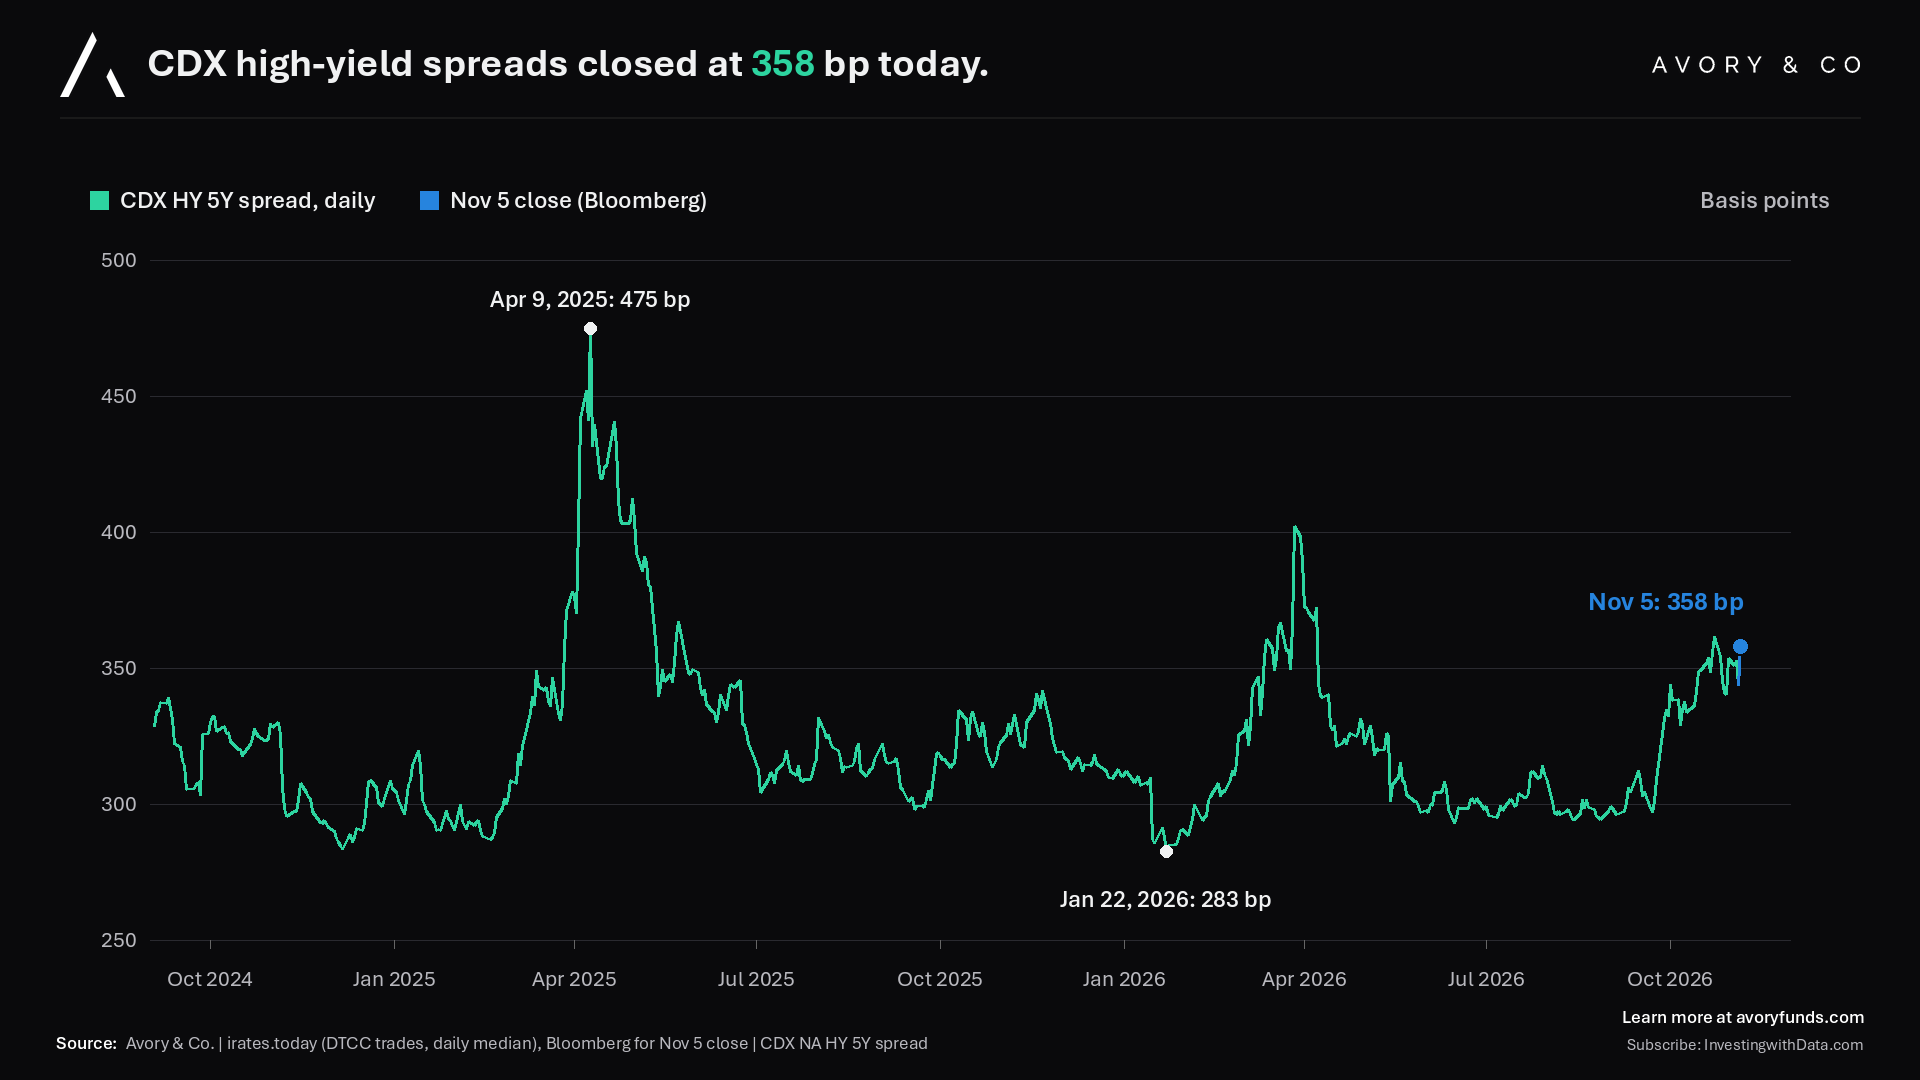
[4] CDX high-yield spreads closed at 358 bp.
This is the one that anchors it for us.
You need to be really scared when credit spreads blow out, and that’s not what’s happening. CDX high-yield spreads closed at 358 bp, up from about 297 in late September, but still below the two scares we already had this year (about 400 in late March) and well below the 475 peak in April 2025.
They have moved fast (about 60 bp in six weeks), so we’re watching.
But credit is repricing I feel, not breaking.
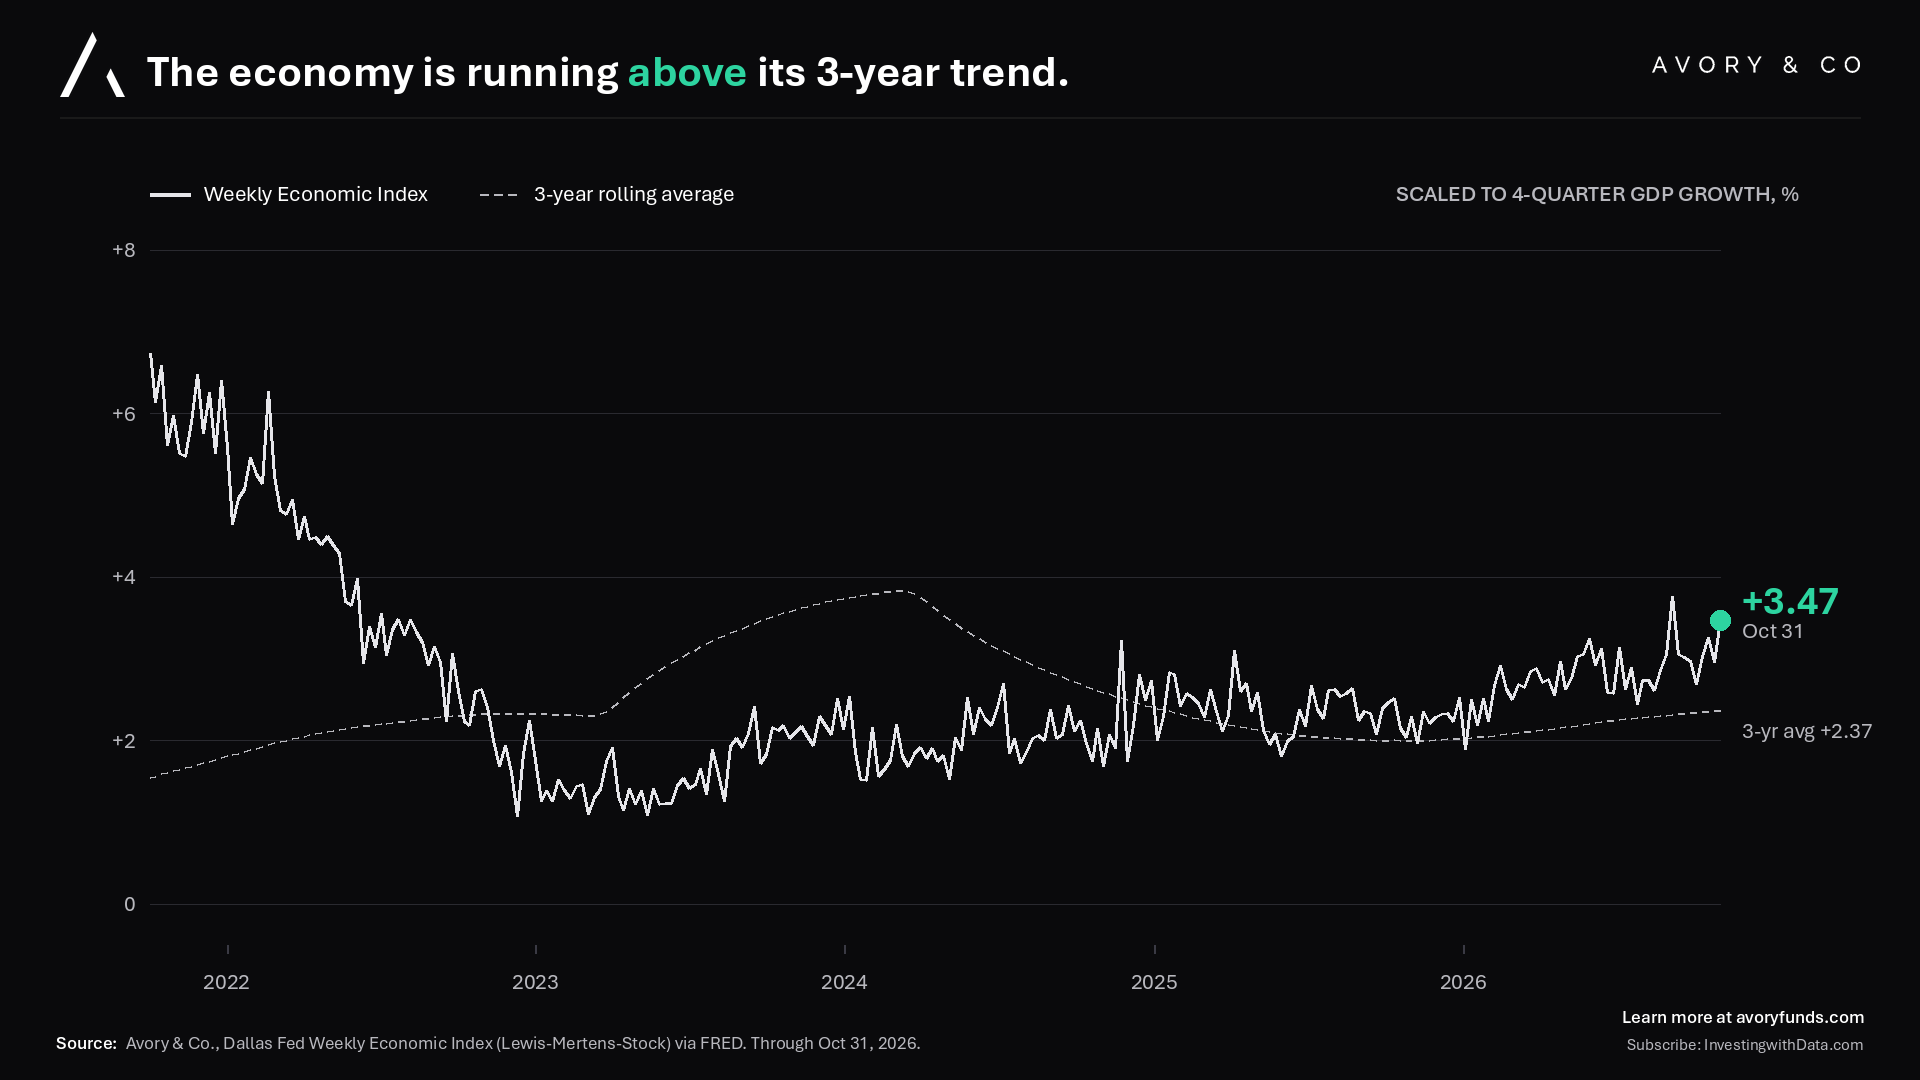
[5] The economy is running above its 3-year trend.
The Weekly Economic Index, which blends 10 real-time indicators into a weekly read on GDP growth, came in at +3.47 for the week of October 31, against a 3-year average of +2.37.
Economic activity remains firm, and that’s the foundation. AI is important to the economy, but there are other areas doing well too.
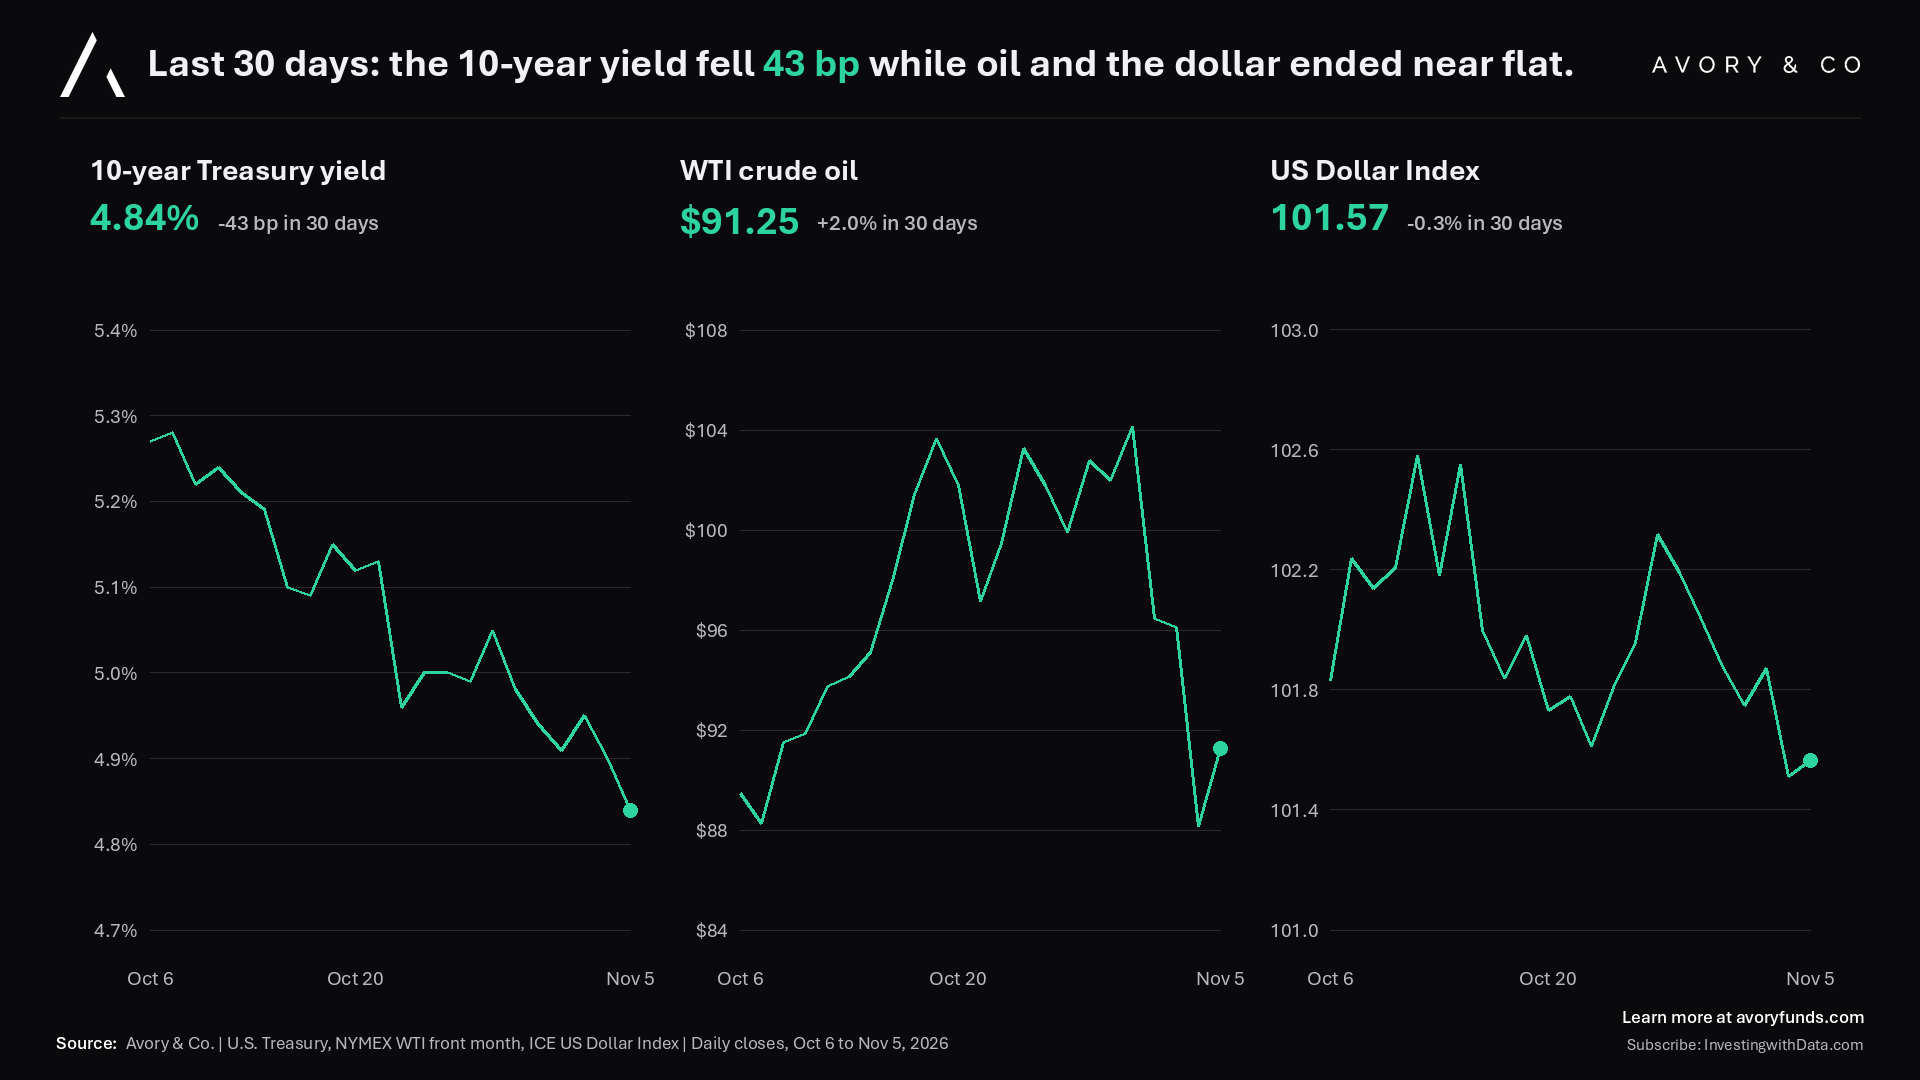
We’ve also seen rates, oil and the dollar come down:
10-year yield at 4.84%, down from 5.31% in early October⁹
Oil (USO) down 13% from its October 23 high⁹
The dollar (UUP) down a bit, about 0.7% from its October high⁹
Those moves are actually supportive, and they naturally loosen financial conditions a little on the margin.
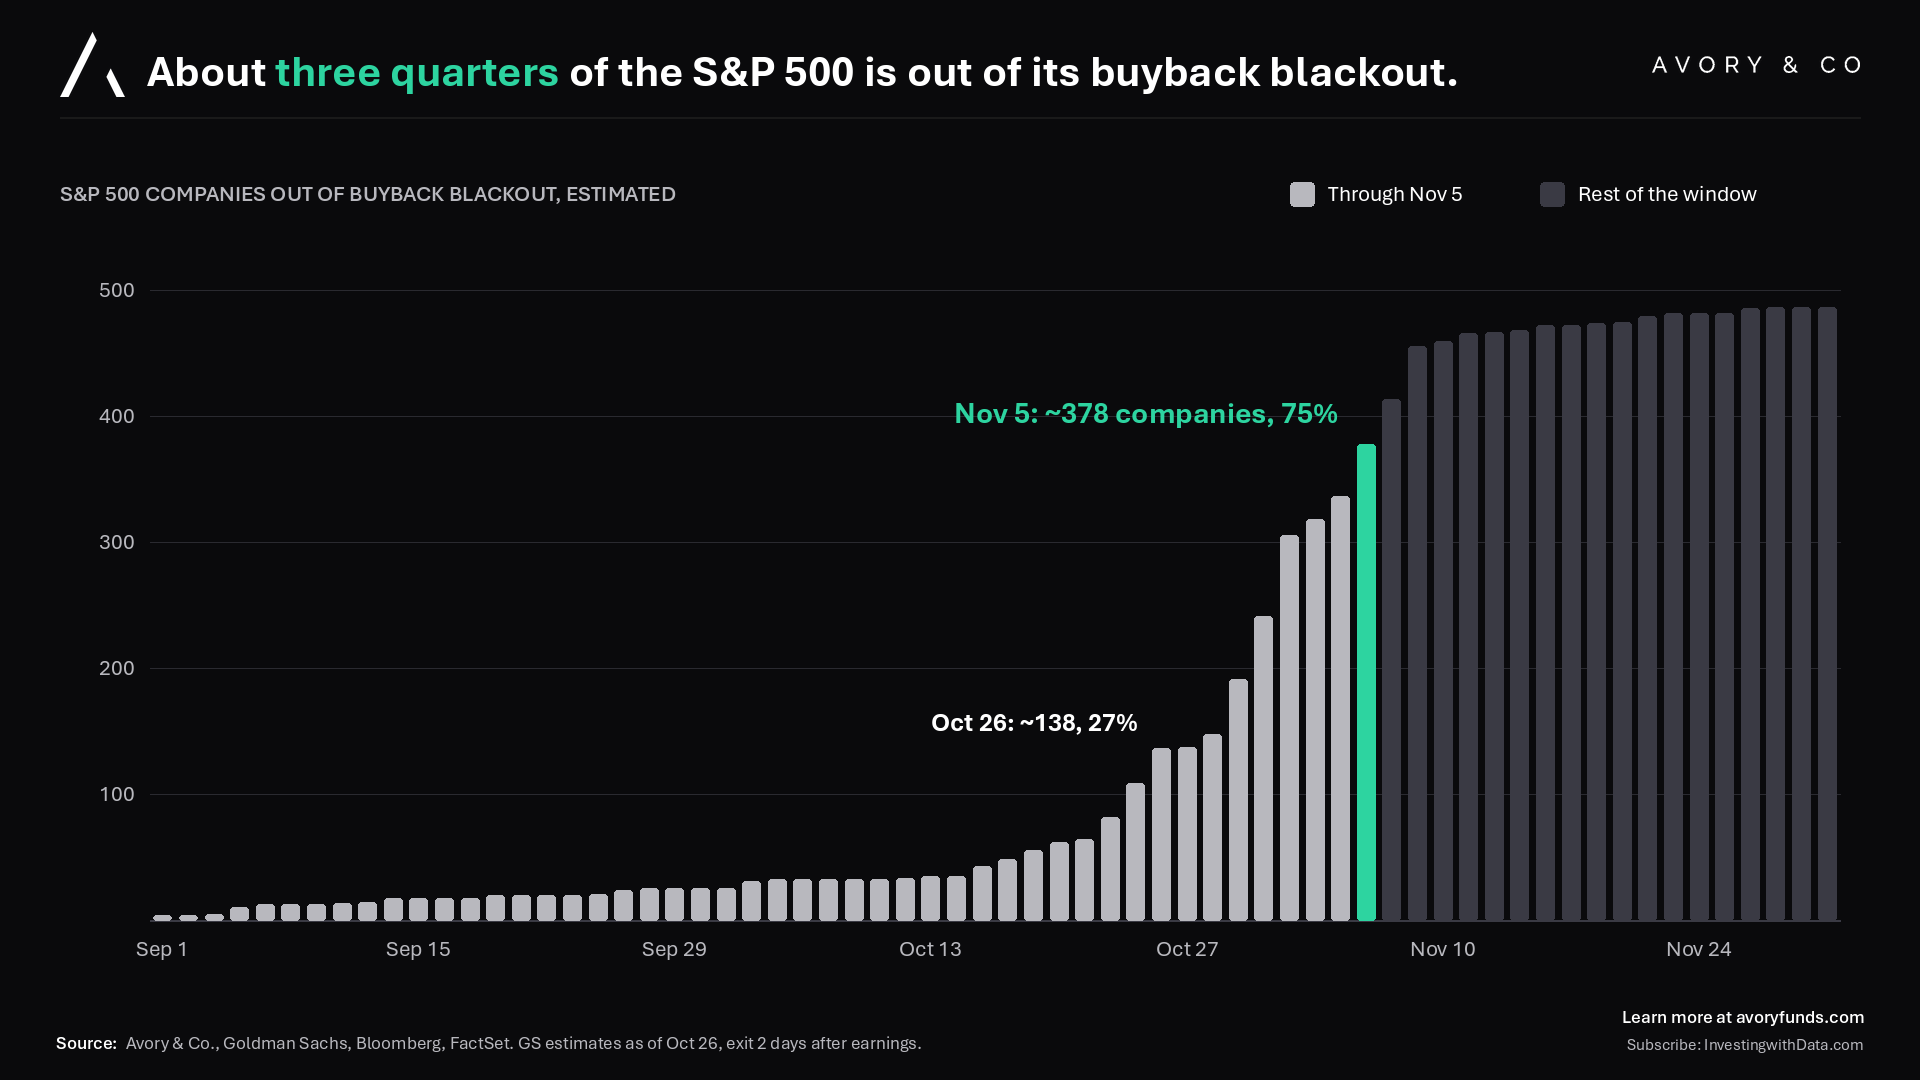
[6] About three quarters of the S&P 500 is out of its buyback blackout.
Next, the buyback window. A quick refresher on the mechanics. Companies typically stop buying back their own stock about two weeks before quarter-end, and they stay out until a day or two after they report earnings.
So every earnings season one of the biggest buyers in the market steps away for a few weeks.
That window is opening back up now.
Less than a quarter of S&P 500 market value was eligible to buy back stock in mid-October, about two-thirds was eligible by Election Day, and it’s expected to hit 85% by November 9.
We’re entering the period where buybacks can turn back on. How big is it? See the next chart.
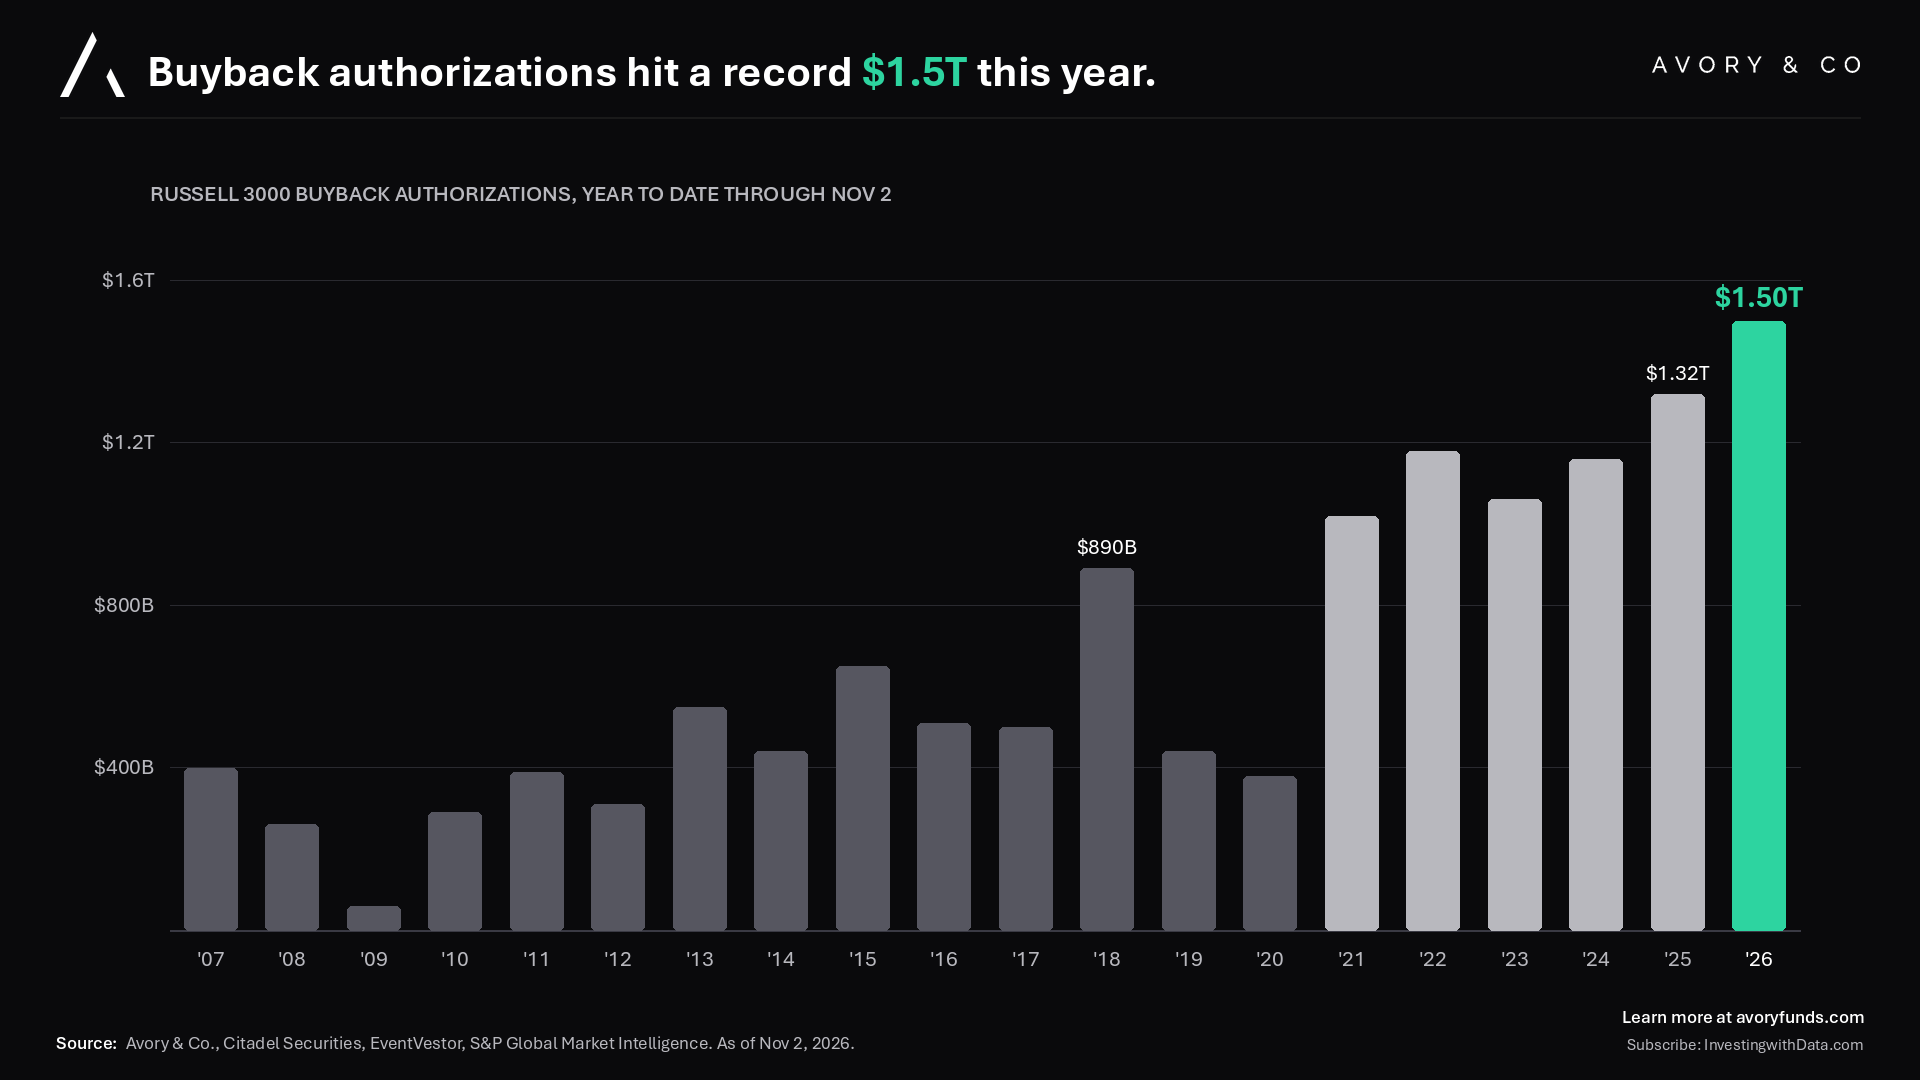
[7] Buyback authorizations hit a record $1.5T this year.
Companies in the Russell 3000 have authorized $1.5T of buybacks so far this year through November 2, already above the full-year record set in 2025.¹¹ That’s up from $1.3T at the end of September. This one from my buddy at Daily Chart Book.
An authorization isn’t a purchase, and not every dollar gets spent. But that’s a lot of approved buying power walking back into an open window right when positioning is already light (more on that in chart 11).
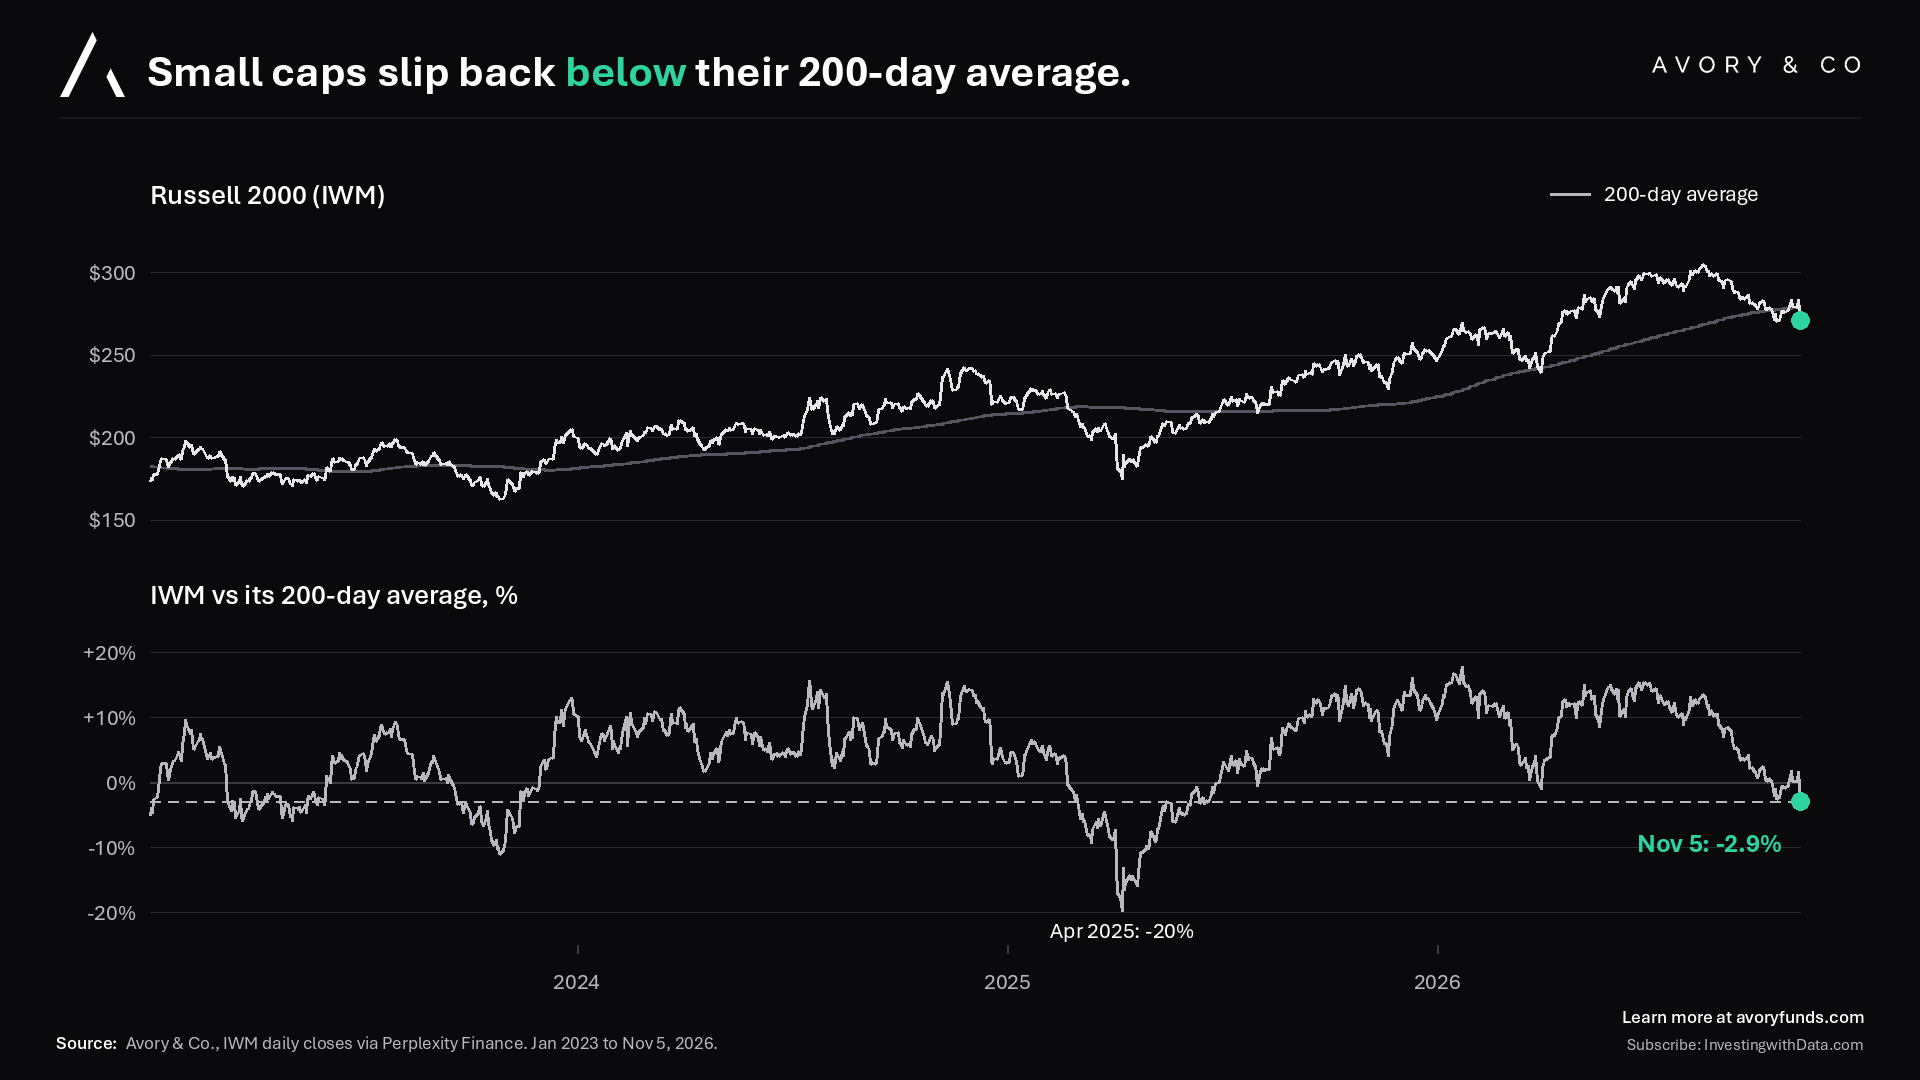
[8] Small caps slip back below their 200-day average.
Now to rotation.
Small caps are actually sending an important signal here. IWM closed 2.9% below its 200-day average yesterday, its first real break of the uptrend this year.
The last time small caps fell well below their 200-day was early 2025 (it got as bad as -20% in April), and small caps went on to work again over the next 6 to 18 months. If it is more like 2024, then this is a buying moment…
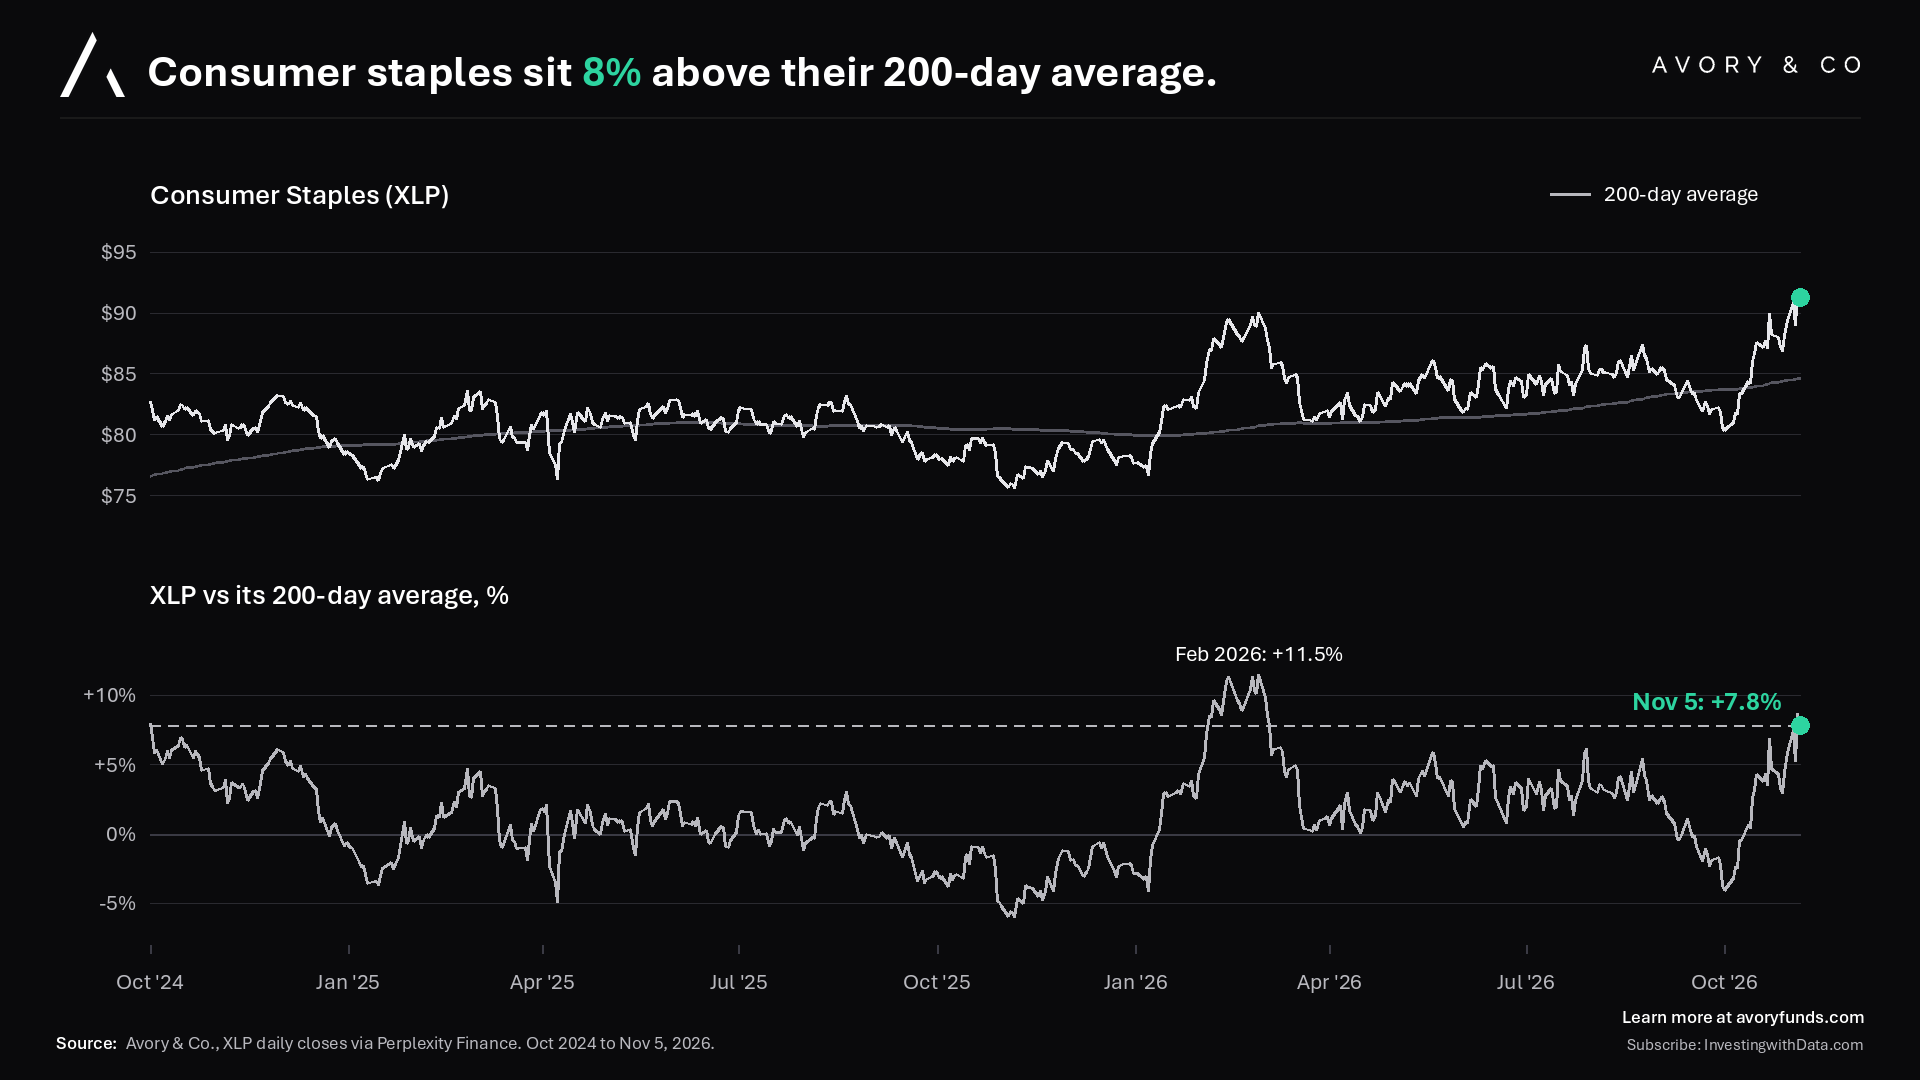
[9] Consumer staples sit 8% above their 200-day average.
On the flip side, the defensive areas are extended. Staples (XLP) closed 7.8% above their 200-day, its highest close in our data going back to 2021.¹³
The only time it’s been more stretched recently was February 2026, at about +11.5%, and it gave most of that back over the next couple of months.
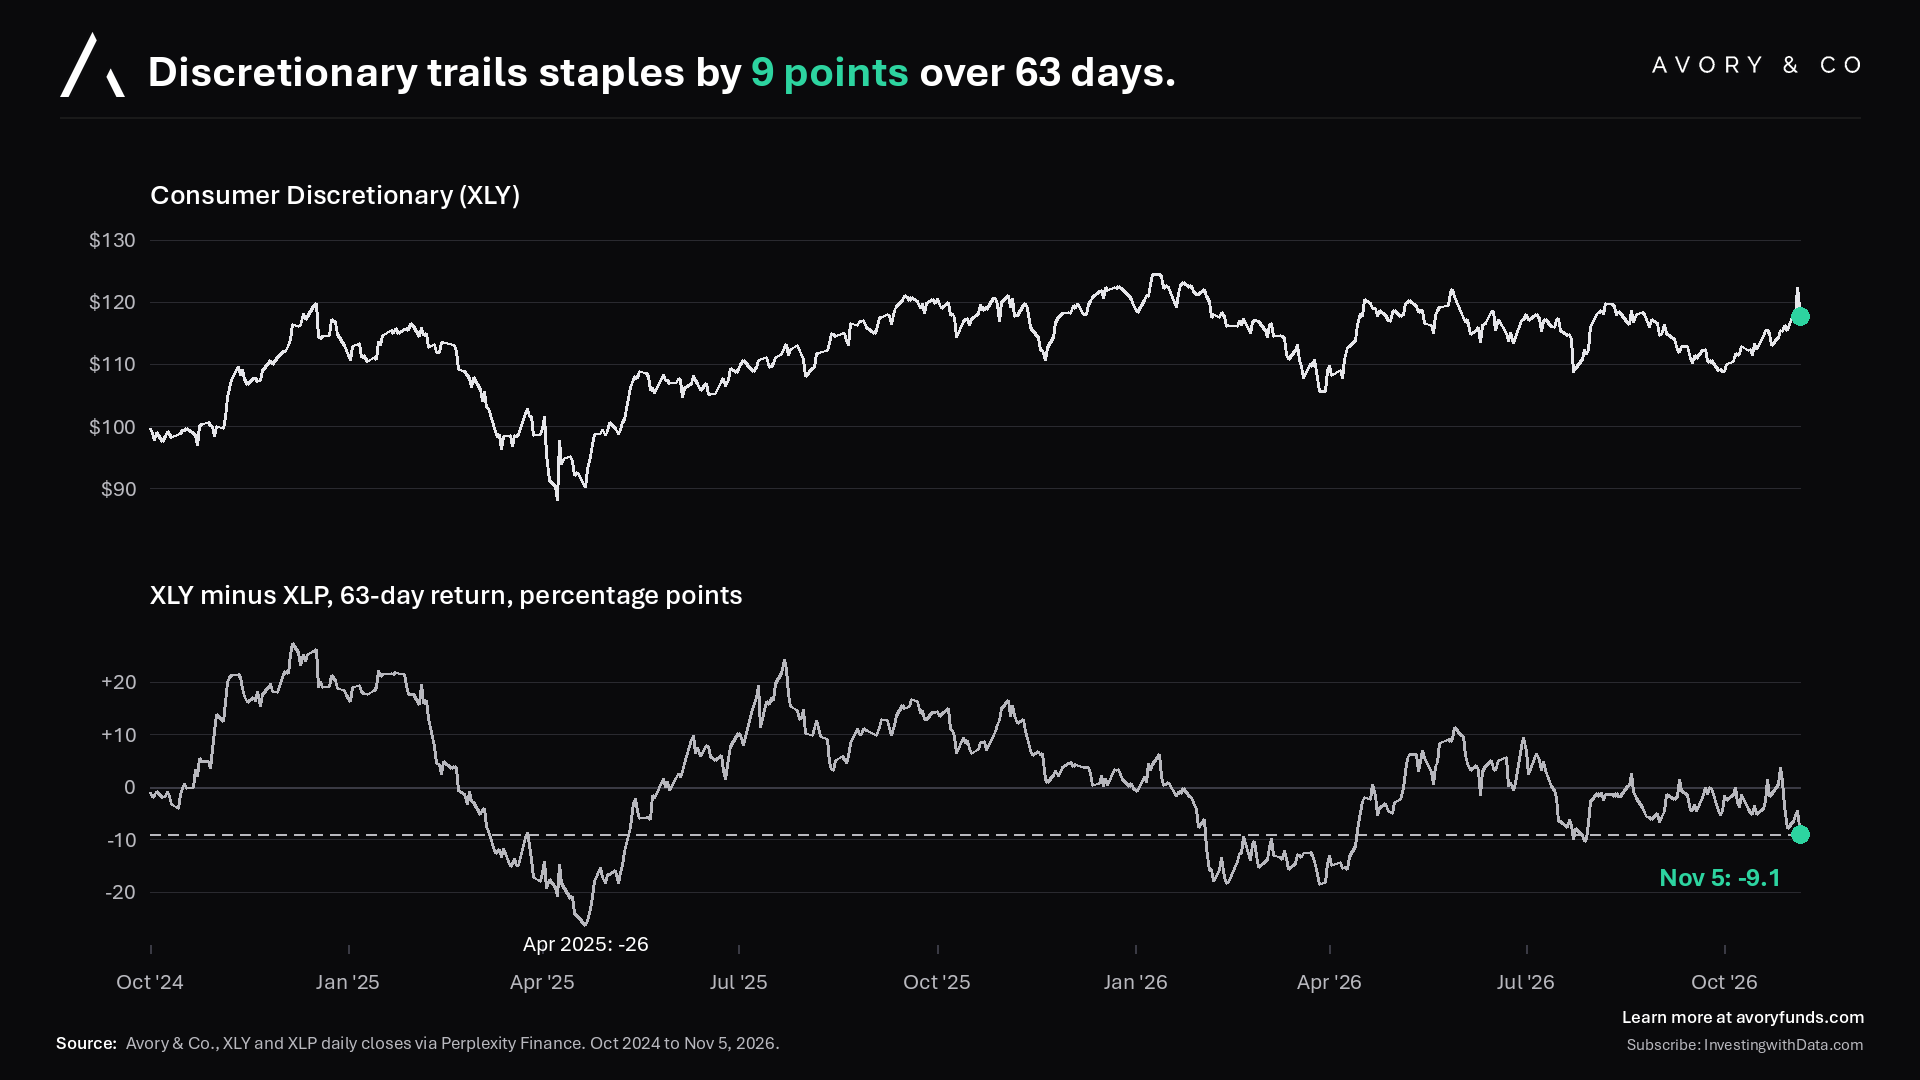
[10] Discretionary trails staples by 9 points over 63 days.
When you look at discretionary vs. staples, discretionary (XLY) has lagged by about 9 points over the last 63 trading days, roughly a quarter.
It’s been about here a few times in the last two years, and each time discretionary took the baton back.
That’s what we think can happen here as we get this clearing event, in what feels like an economy that’s fine, with gridlock in government, rates falling and oil falling. That’s good news and SweetGreens stock is surging here as I write this…
At some point readings like these are signals of stress, but again, credit spreads don’t suggest that.
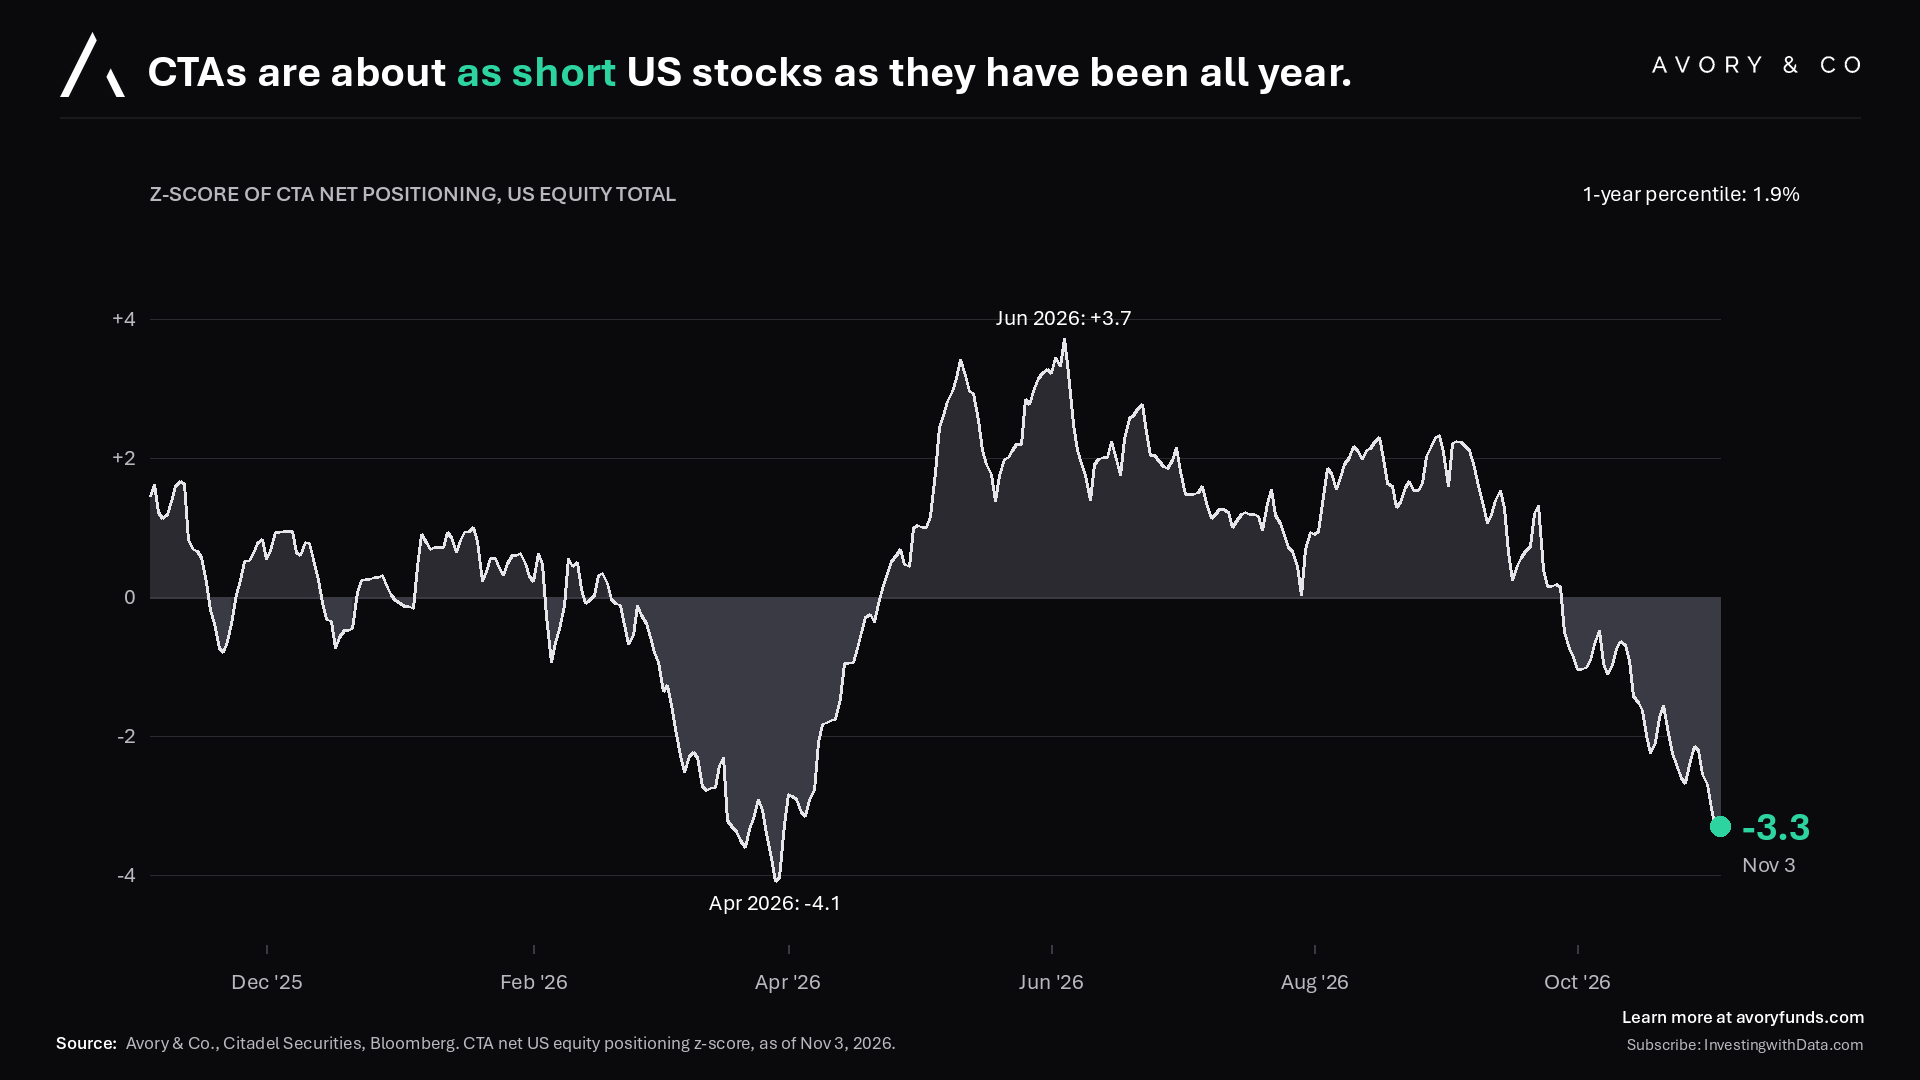
[11] CTAs are about as short US stocks as they have been all year.
CTAs (the trend-following funds) are sitting at -3.3 standard deviations on US equity positioning, the 1.9th percentile over the past year.
The only time this year they were shorter was April.
Things can get worse obviously, but positioning already seems stretched, which leaves a lot less selling left to do from this group.
Again all this stuff is starting to rhyme right??
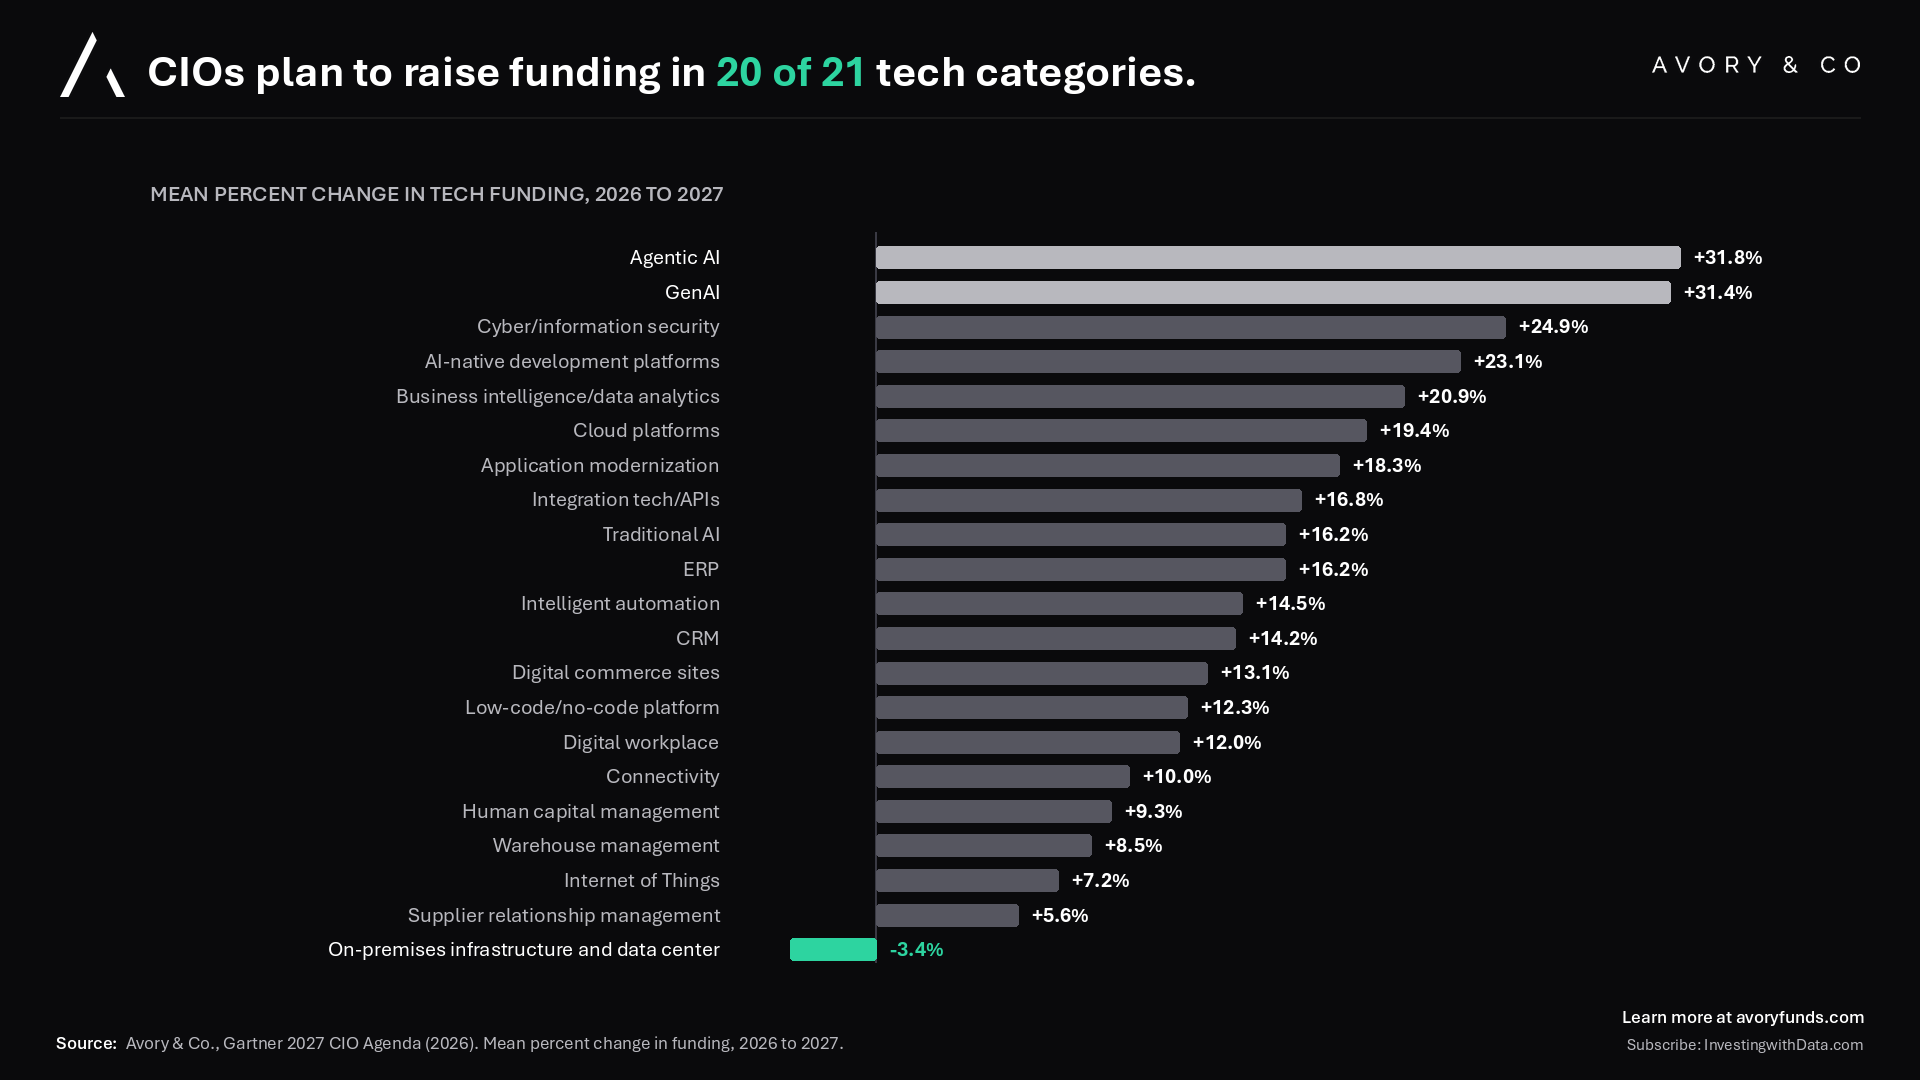
[12] CIOs plan to raise funding in 20 of 21 tech categories.
And to end on what the buyers of tech are saying. Gartner’s 2027 CIO survey shows funding going up in 20 of 21 technology areas next year.¹⁵ Agentic AI leads at +31.8%, then GenAI at +31.4%, cyber/information security at +24.9% and AI-native development platforms at +23.1%. The only cut is on-premises infrastructure and data centers, at -3.4%.¹⁵
That’s CIOs staying confident in tech spending across what feels like the entire stack, even with overall IT budgets only expected to rise about 3.7%.¹
The money is getting little more specific, just like the stocks… but overall healthy survey
Net Net
This week was about fear and positioning, not credit or growth (YET). The VIX spiked and inverted, staples got stretched and small caps broke their trend, but credit is still below this year’s prior scares, the economy is running above trend, buybacks are coming back and CTAs are already short.
We think AI is going through a reset of what will win and what won’t, a lot like 1997 and 1998, and that’s healthy. We’ll keep owning what we think is durable, and if some of it gets cheaper, we adjust. A choppy path forsure, but a constructive one.
That’s all for this week!
Sources
Cboe, VIX Index historical data, Jan 1990 to Nov 5, 2026. Avory & Co. calculation. Link
Nvidia (NVDA) daily closes, Oct 6 to Nov 5, 2026. Link
S&P Dow Jones Indices, S&P 500 daily closes, price returns. Link
Cboe VIX and VIX3M, SPY daily closes, Jan 2022 to Nov 5, 2026. Avory & Co. calculation. Link
Federal Reserve Bank of St. Louis, Federal Funds Target Rate (DFEDTAR). Link
Federal Reserve Bank of St. Louis, NASDAQ Composite Index (NASDAQCOM). Link
irates.today, CDX credit dashboard (DTCC trades, daily median), and Bloomberg for the Nov 5 close. Link
Federal Reserve Bank of St. Louis, Weekly Economic Index (Lewis-Mertens-Stock), through Oct 31, 2026. Link
Cboe 10-Year Treasury Yield (^TNX), USO and UUP daily closes, Aug 1 to Nov 5, 2026. Link
Citadel Securities, Global Market Intelligence, “November.” Link
Bloomberg via Yahoo Finance, “Citadel Securities’ Rubner Says Stocks Are Set Up for Year-End Gains After Vote,” Nov 5, 2026. Link
Citadel Securities, Global Market Intelligence, “October: The Q4 Reload.” Link
IWM, XLP and XLY daily closes, Jan 2023 to Nov 5, 2026. Avory & Co. calculation. Link
Citadel Securities, CTA positioning, US equity total (Bloomberg data), as of Nov 3, 2026. Link
Gartner, 2027 CIO Agenda Preview, Oct 2026. Link
Gartner, “CIO Planning for 2027: Close the AI Ambition Gap.” Link
About Avory & Co.
Investing Forward.
www.avory.xyz / www.avoryfunds.com
Avory specializes in high-conviction equity strategies, emphasizing Secular Growth and Transformation Stories driven by exceptional teams. Data guides decisions. We cater to high net worth investors, family offices, and institutional investors. Note: This information doesn’t constitute a recommendation to buy or sell any mentioned securities. Avory is based in Miami, Florida with clients all across the globe.
Speak to us:
Send us an email: Team@avoryco.com
Want to invest? We are on most platforms.
Want More
🎥 Avory YouTube: Channel
🎙️ Avory: Podcast
Disclaimer: Not a recommendation to purchase or sell any securities mentioned. This is for educational purposes only.