
The Market Isn’t Wrong About Hormuz. The Bears Are.
Here's the math.


The market keeps shrugging at the Strait of Hormuz, and the bears keep calling it irrational. The numbers say it isn’t. Roughly $255B in fresh dollars is on its way into the US economy this year, and most of the desk research hasn’t priced it in.
There is a recurring question I keep getting from investors or our advisor clients right now. How is the market still holding in when oil ripped from $61 to $118, when shipping through Hormuz was de facto closed for weeks, and when the geopolitical headlines read like 2022 all over again? On the surface, that is a fair question. Underneath it though the answer is just math… let’s jump into it.
Three structural offsets, two policy refunds, and one shifted producer base mean the net dollar flow into the US economy in 2026 is positive, sizable, and almost entirely separate from anything the Fed has to do.
Sean Emory from Avory & Co on Bloomberg TV Global.
Let me walk through it in the order I worked it out, and qualify each piece with a real number from a real source.
Before that, here’s what prediction markets think about WHEN traffic at the strait returns to normal. 16% chance in May… ie the market is already priced for closure.
Now lets get into it…
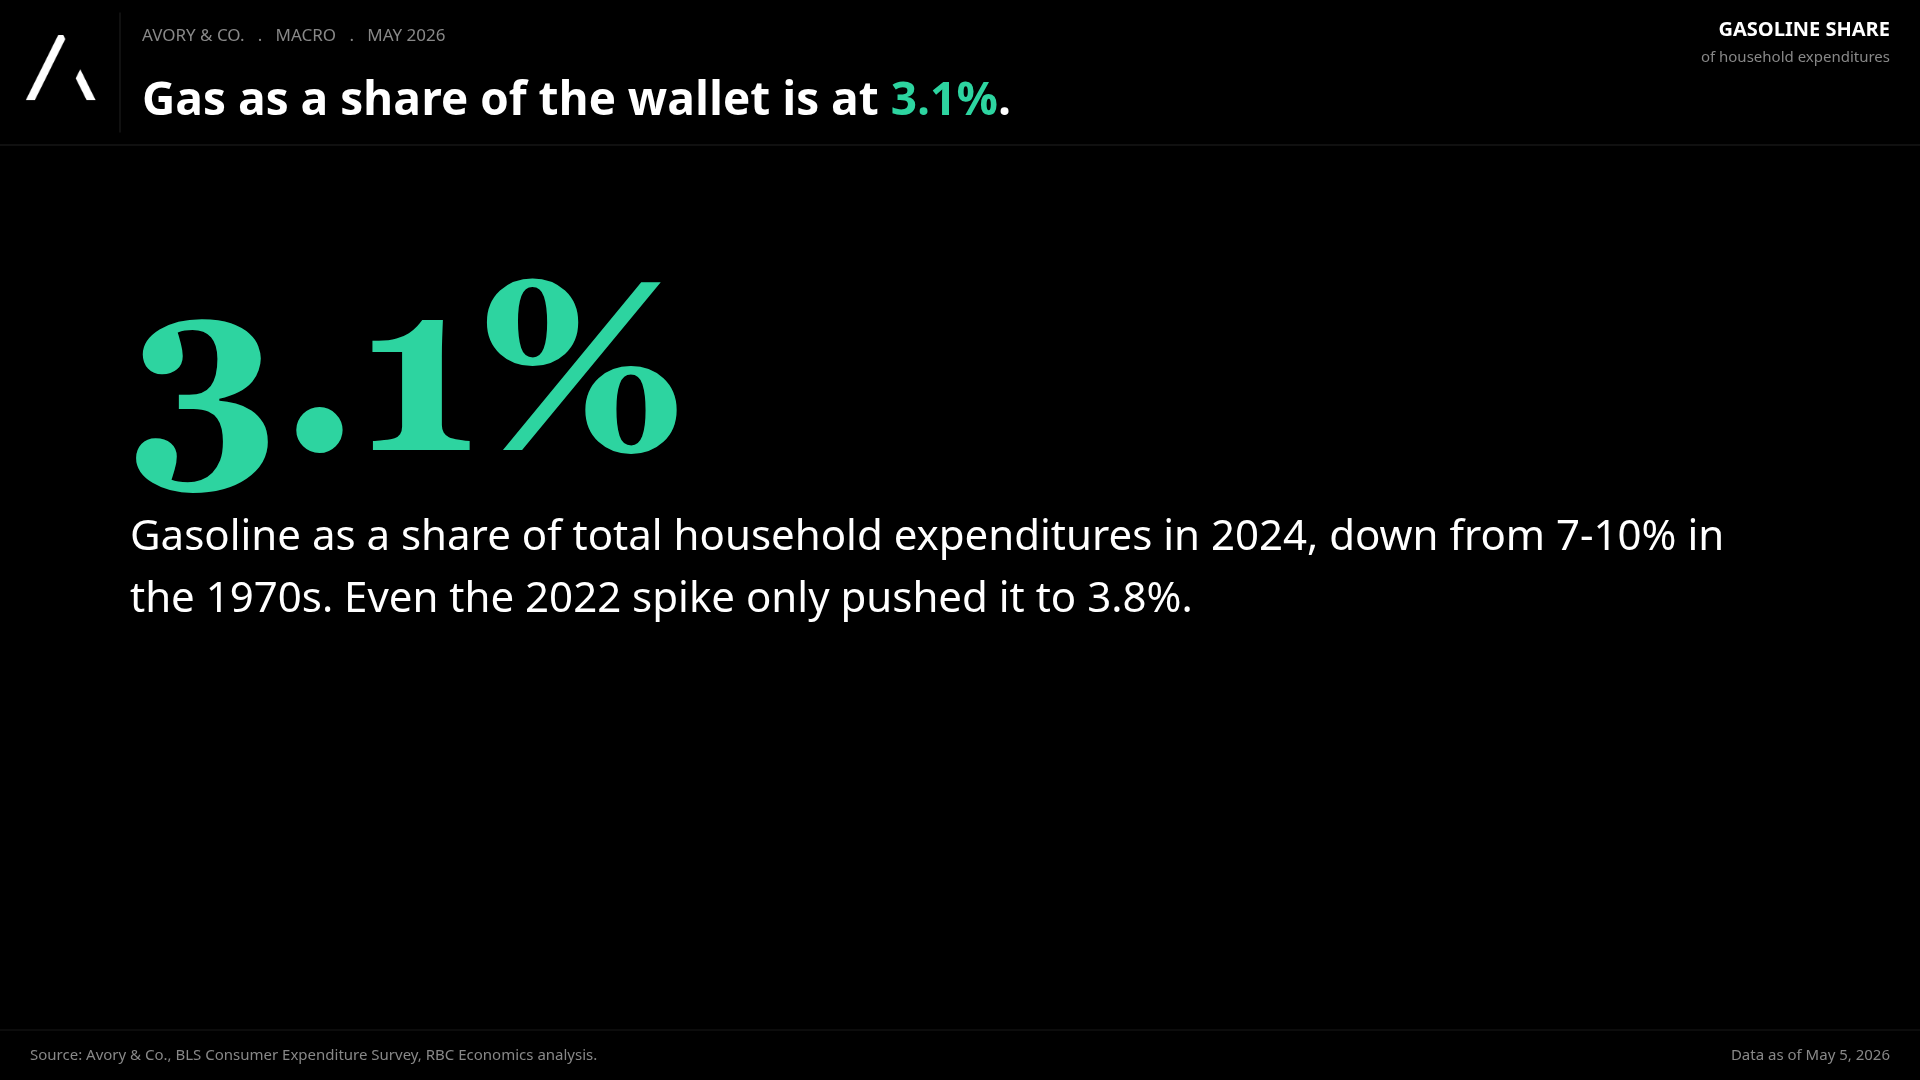
The oil shock is real. The wallet impact is half what it used to be.
Why a $120 Brent print doesn’t hit the consumer the way it would have in 1979.
In 2024, the average US household spent $2,411 a year on gasoline, which works out to 3% of total household expenditures. That is straight from the BLS Consumer Expenditure Survey. Compare that to the 1970s, when energy products were 7-10% of real consumer spending. So roughly half the wallet share.
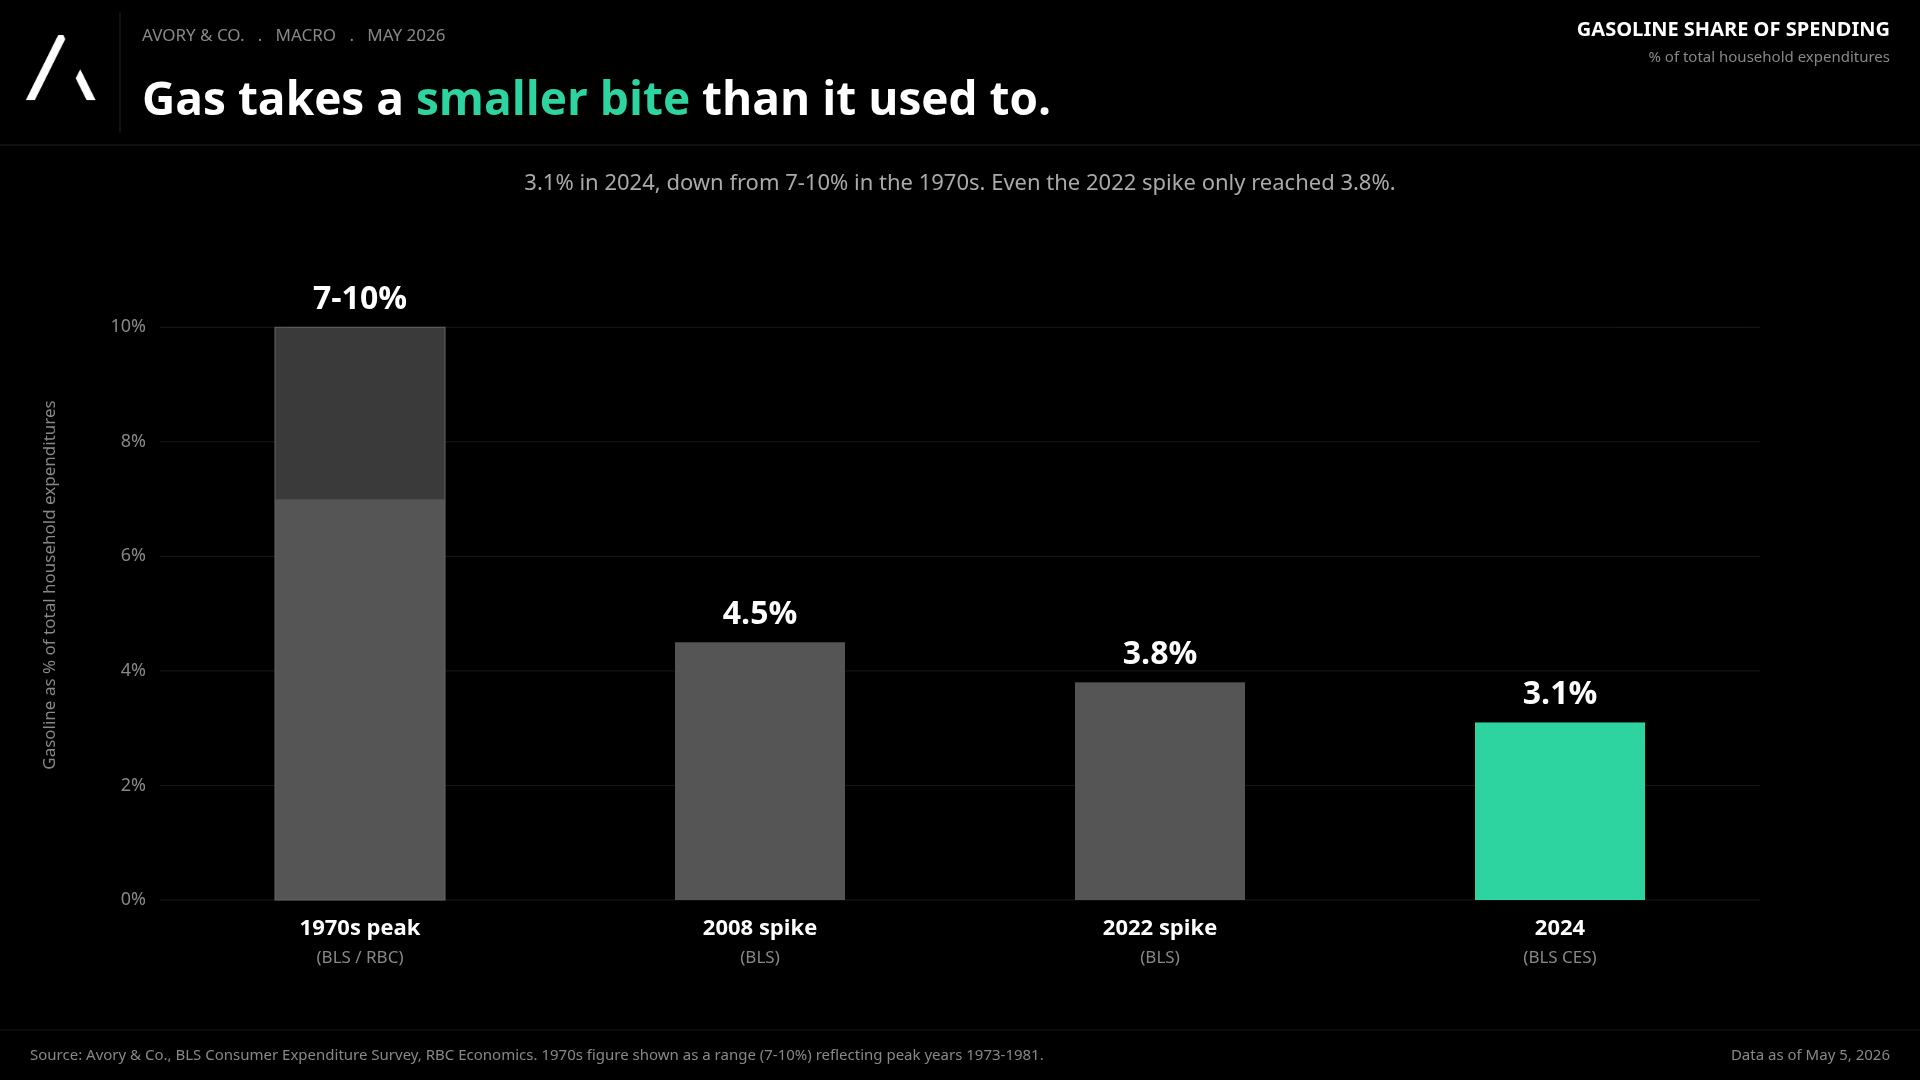
The Kansas City Fed put numbers on this directly. Their analysis concludes that gasoline expenditure shares are about 1% point lower across all income quintiles than they were in 1984, and that the effect of oil price changes on consumption has become much more muted, even among lower-income households.
The pass through math reinforces the point. Academic research shows oil price pass-through into broad consumer prices is about 4.2% in the long run. We know this continues to move lower. So a 50% oil shock translates to roughly 2 percent of headline CPI pressure, not 5 or 6% we have seen in prior decades.
Real oil is elevated. It is not extreme.
The level matters less than the comparison. Compare correctly people
WTI, in inflation-adjusted terms, suggests the average YTD run rate for oil prices ($83) is only about 13% above the inflation-adjusted average going back to 1980. Important because the 1980s oil peak would be equivalent to something in the mid-$100s today, or roughly 30% to 50% higher than current levels. And even then, as we just discussed, oil had a much larger impact on the consumer wallet than it does today. So yes, oil prices are elevated relative to history, but they are nowhere near prior inflation-adjusted shock levels, and their contribution to consumer spending pressure is less meaningful than it was in past cycles.
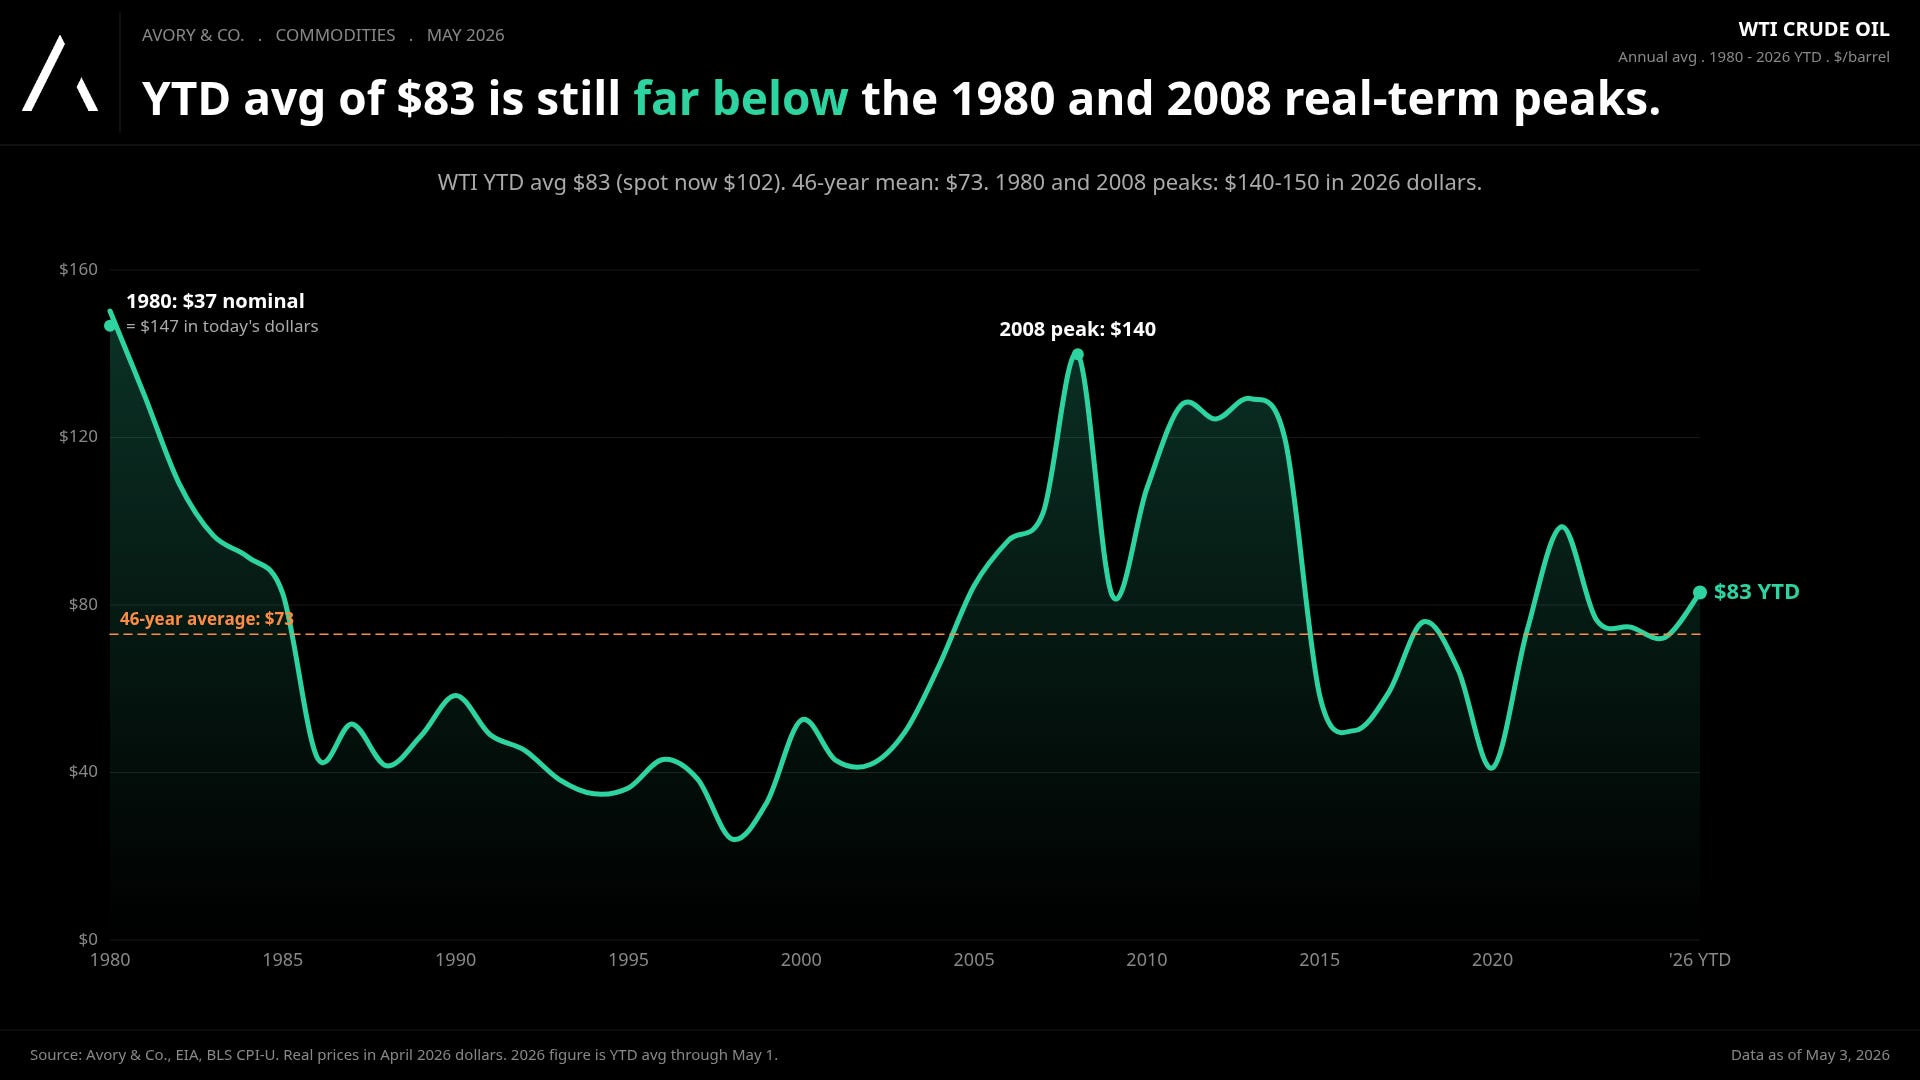
There is one important caveat the bulls should not gloss over though. The EIA itself flagged Q1 2026 as the largest inflation-adjusted Brent move since 1988. So while the level is not a record, the velocity of the move is genuinely historic. That is the part of the bear case that is real. But then there are other offsets that happen to hit at the same time. Here are some of those..
The US is now a net exporter.
In the 1970s, an oil spike was pure tax. Today, half of it is revenue.
This is the structural piece that most analysts trained in a different era still get wrong. Per the EIA, the United States exported 55% of its petroleum production in 2024, and total petroleum net imports were the lowest on record. During the Q1 2026 disruption, US crude exports surged to record levels as global buyers sought alternatives to Middle East supply.
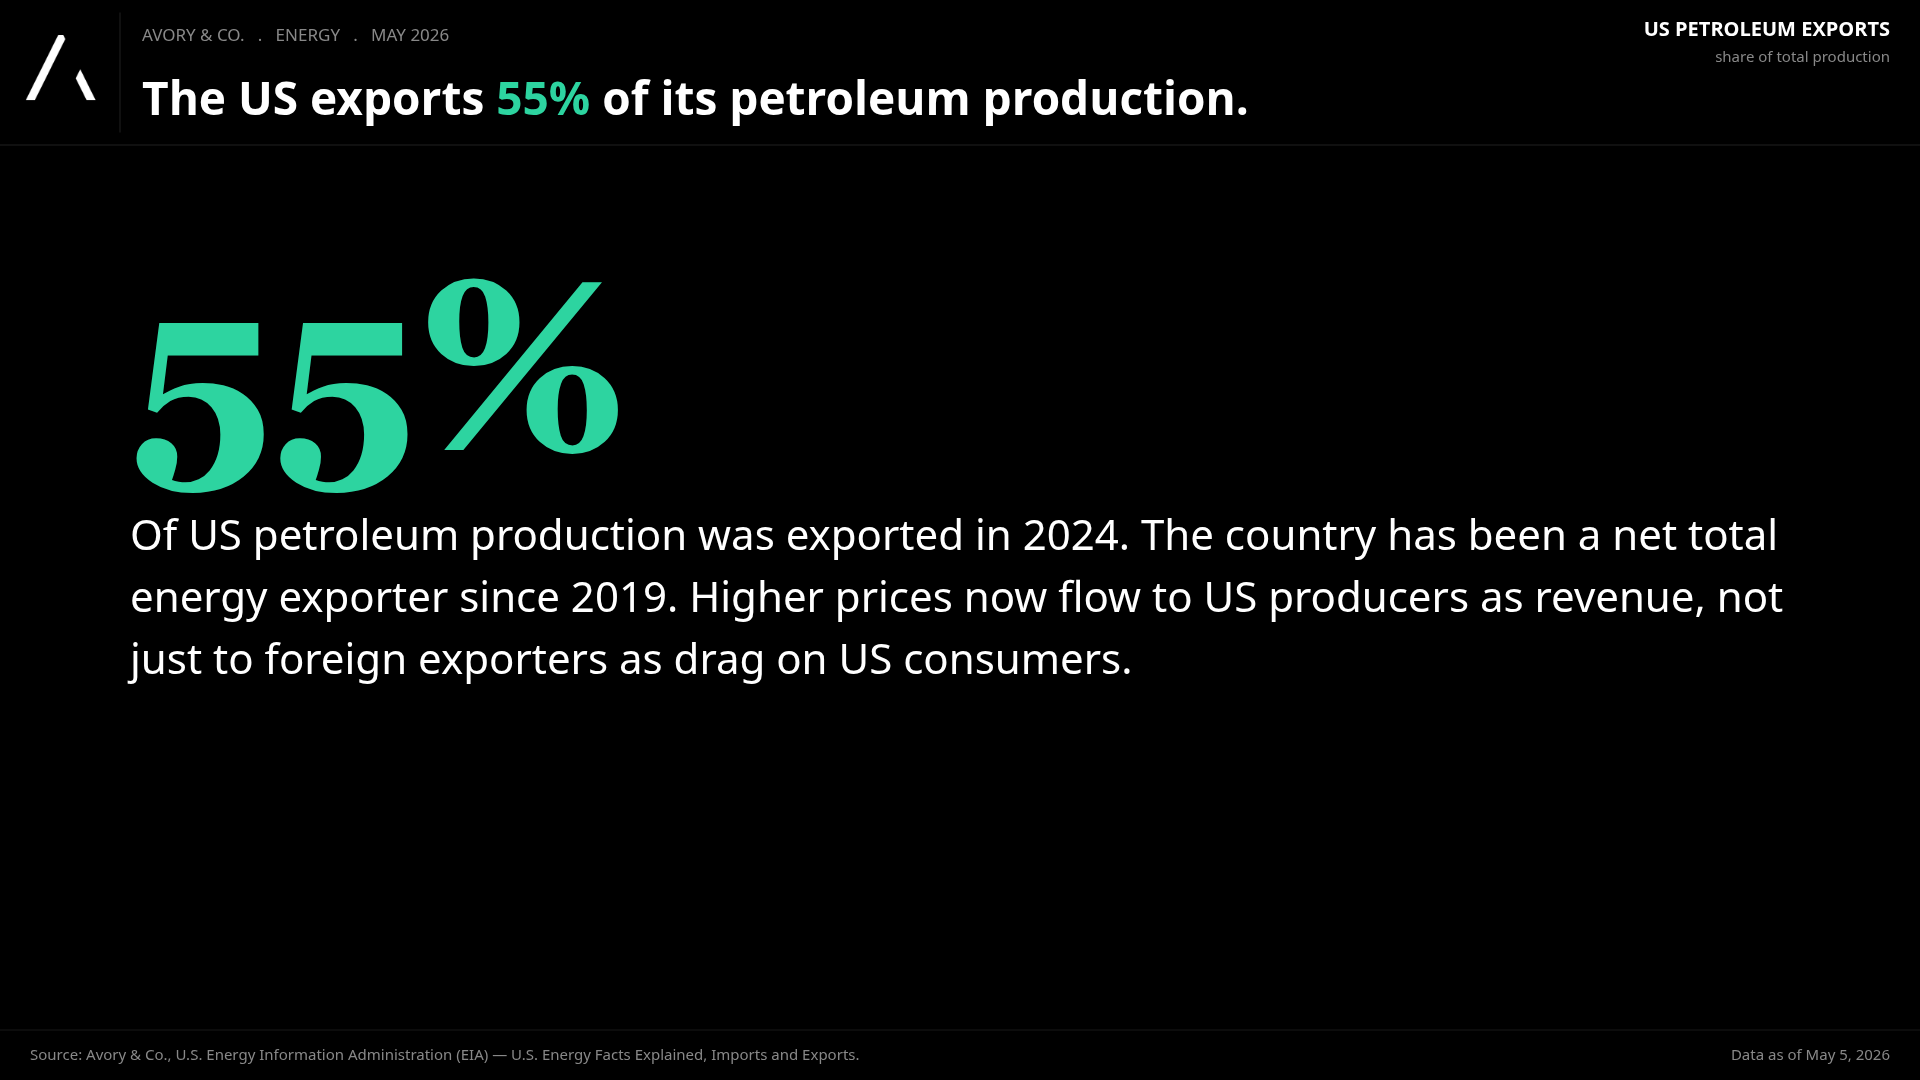
Also this chart tells that story very clearly.
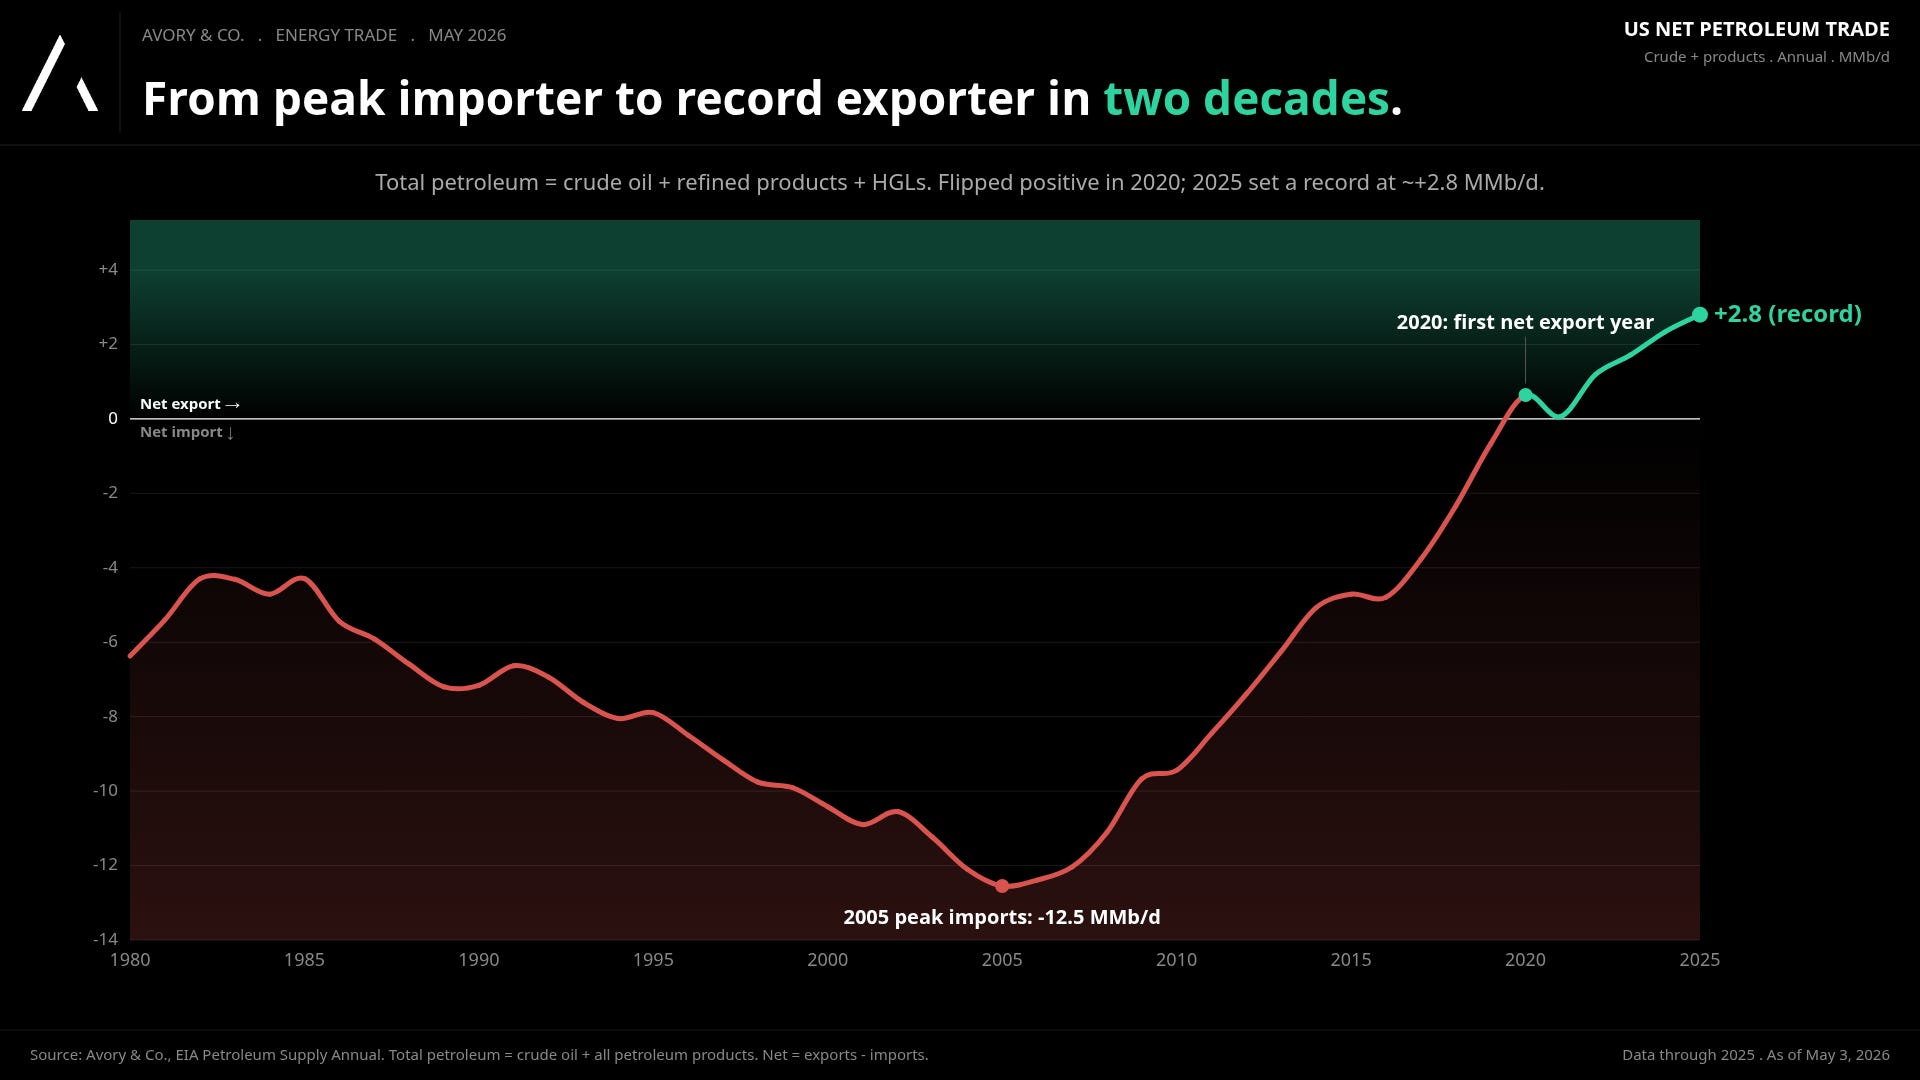
Translation to above: when crude rips, a meaningful share of the dollars consumers spend at the pump cycle back through US producer revenue, capex, hiring, and royalty payments to landowners.
The Kansas City Fed calls this the “oil producer channel” and notes it is materially more important to the US economy than it was during the 2014 to 2016 slump, let alone the 1970s.
The net drag on the broader economy is a fraction of the gross drag on consumer wallets when isolated by itself.
The OBBBA tax cut is already in checking accounts.
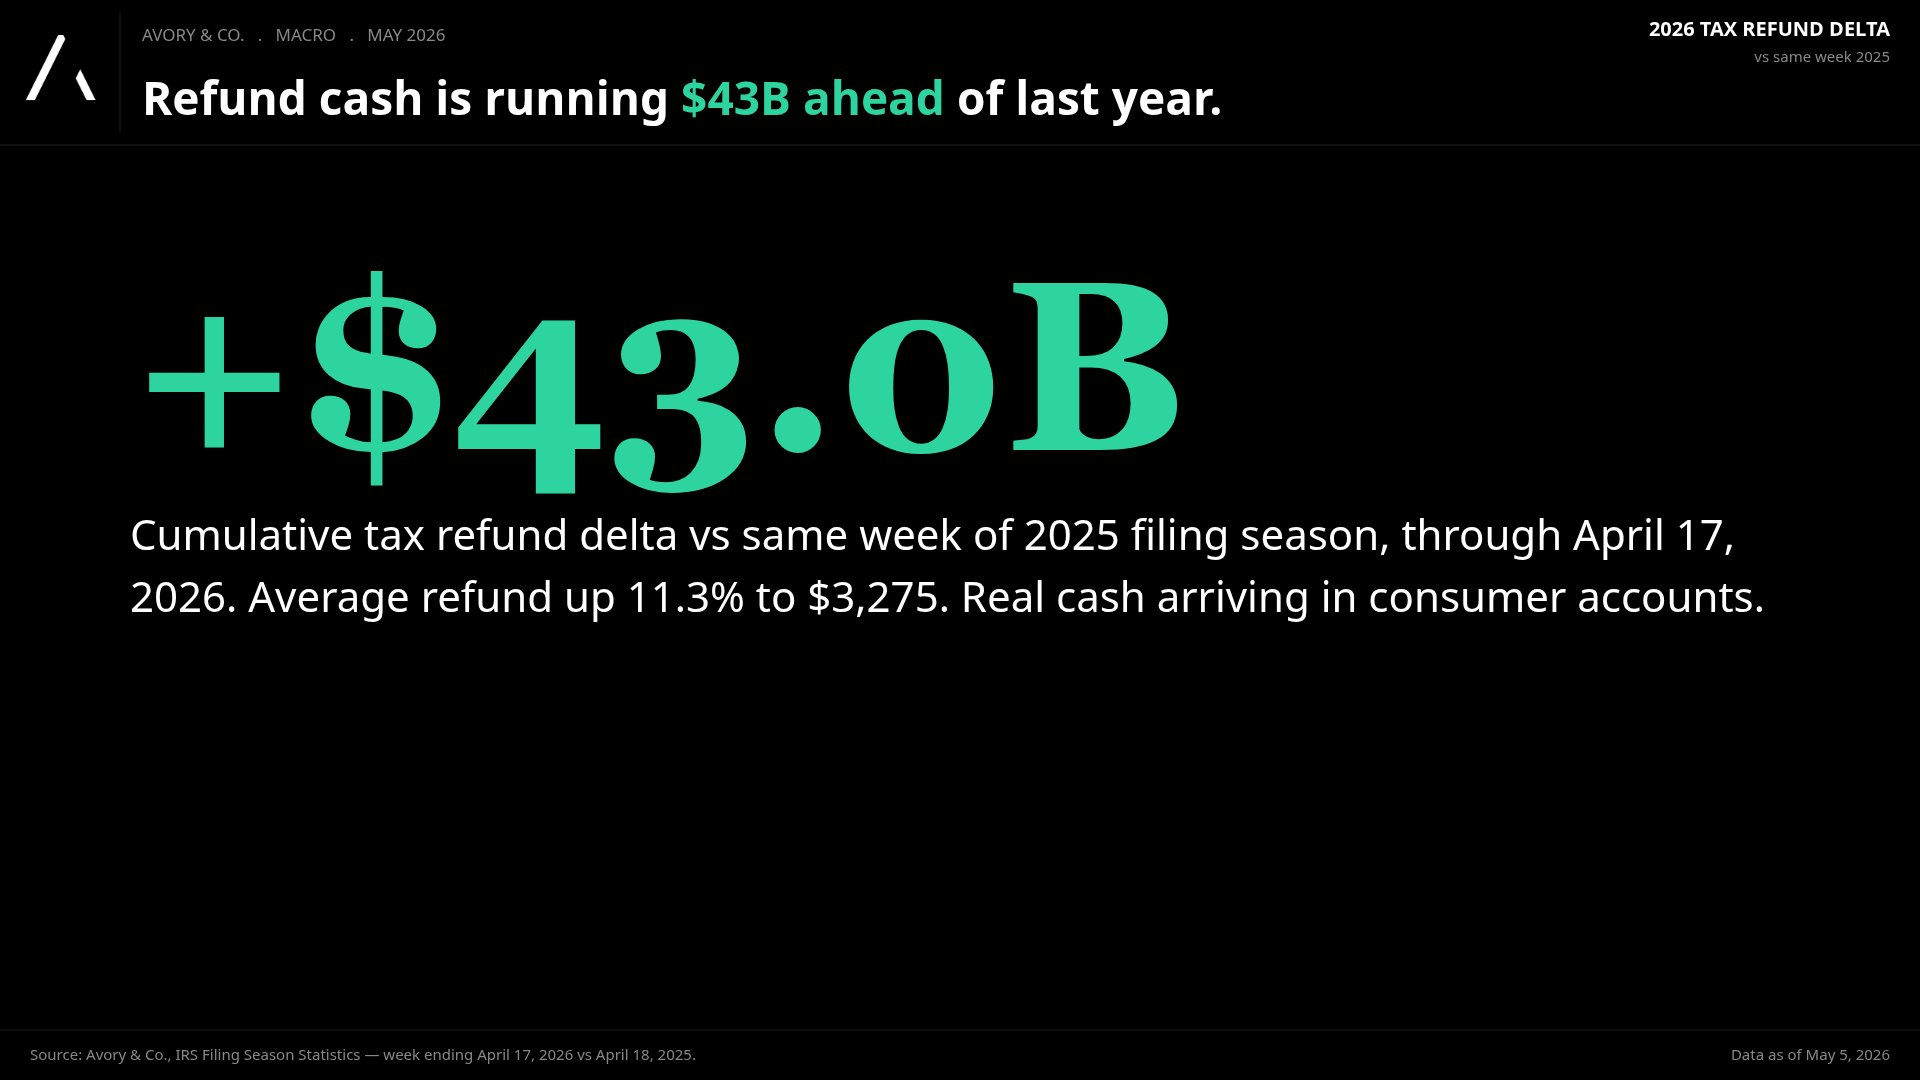
Refunds are running $43B ahead of last year, and we are not done filing.
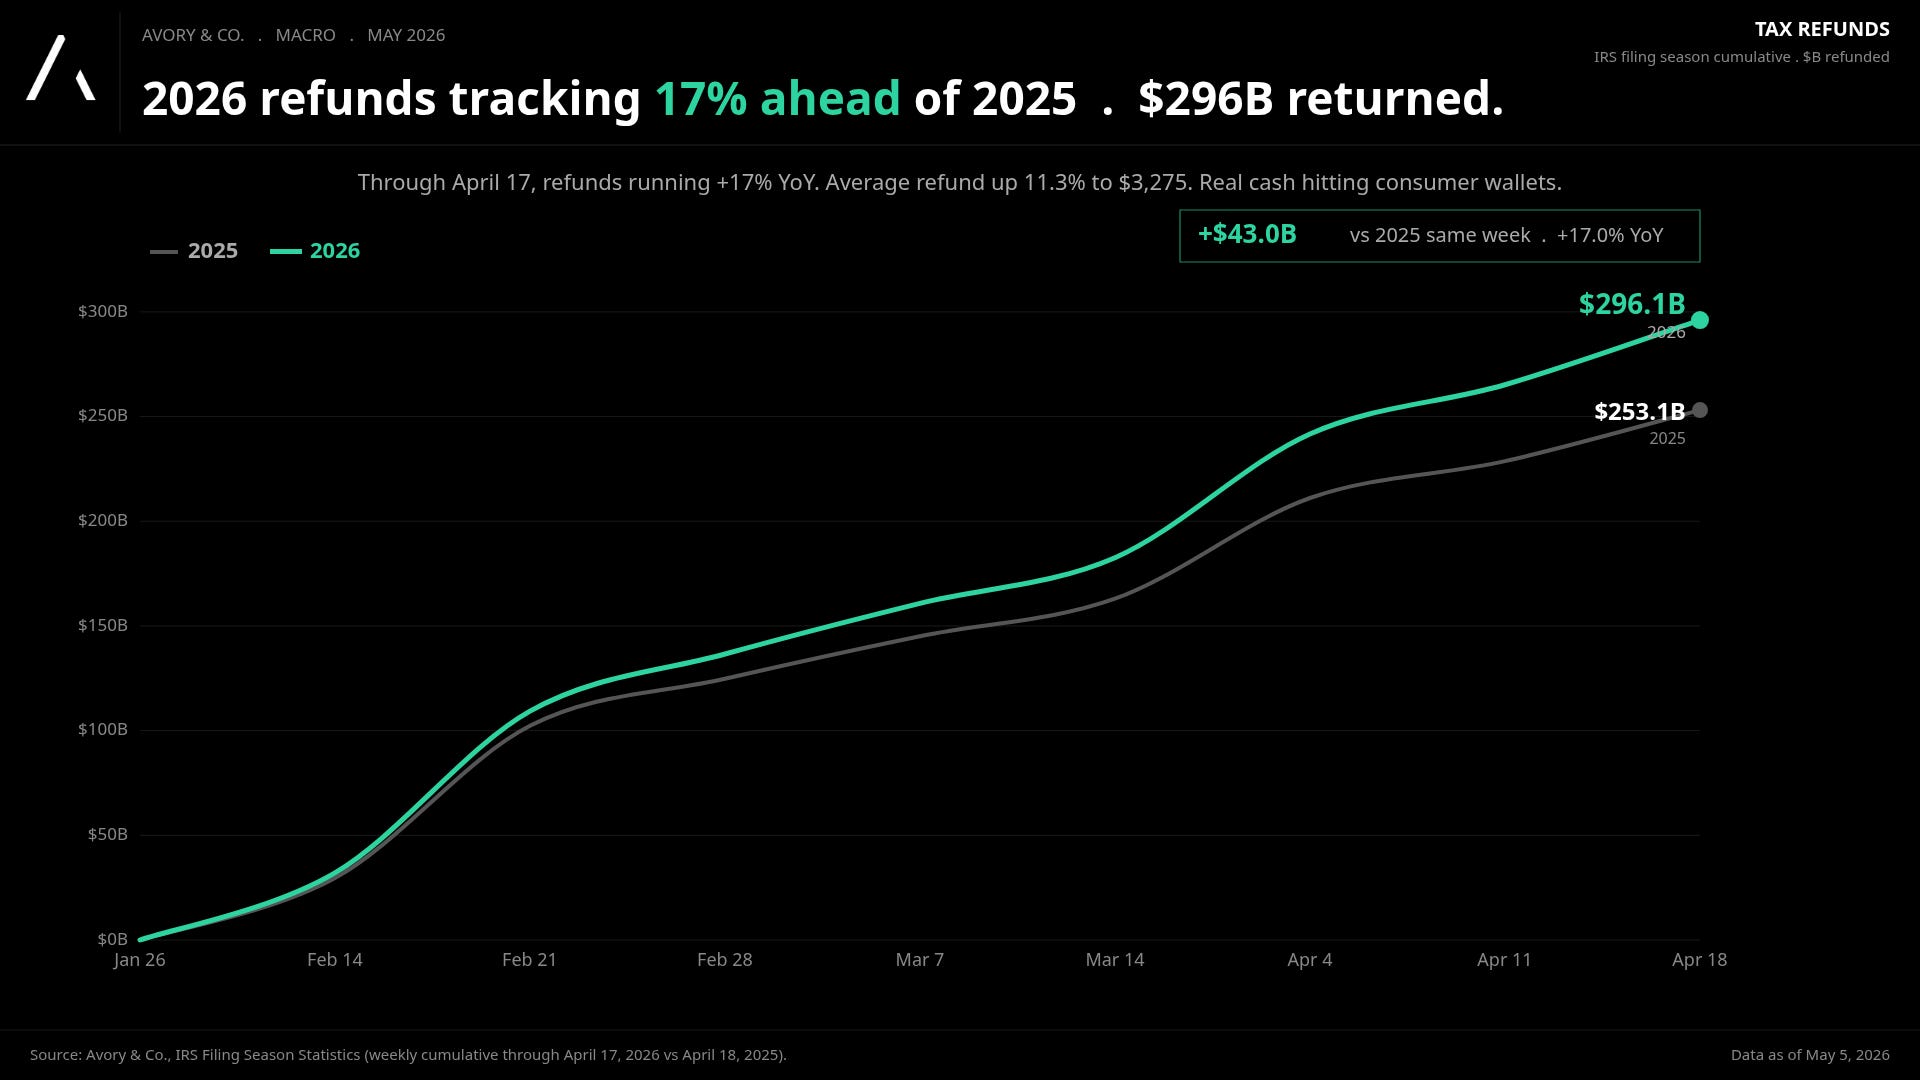
Through April 17 of the 2026 filing season, total refunds were running $43.0B ahead of the 2025 pace, with cumulative refunds of $296.1B versus $253.1B at the same point last year. That is a +17.0% year over year pace, and the average refund is up 11.3% to $3,275. The IRS Filing Season Statistics confirm the pattern week by week.
This is the Tax Act from last year feeding through. Something we discussed early last year. It includes deductions for tips, overtime, auto loan interest, and senior citizens, and the math shows household after-tax income just got a real lift.
Annualized, with the rest of the season still to come, the full year incremental refund delta is plausibly $55-65B higher than 2025. Real cash, hitting real households, in real time, at same time as oil shock. That’s what I meant when stating that the oil shock occurring at the best time it could have.
The tariff refund is the other input nobody is talking about (still).
The Supreme Court invalidated IEEPA tariffs.
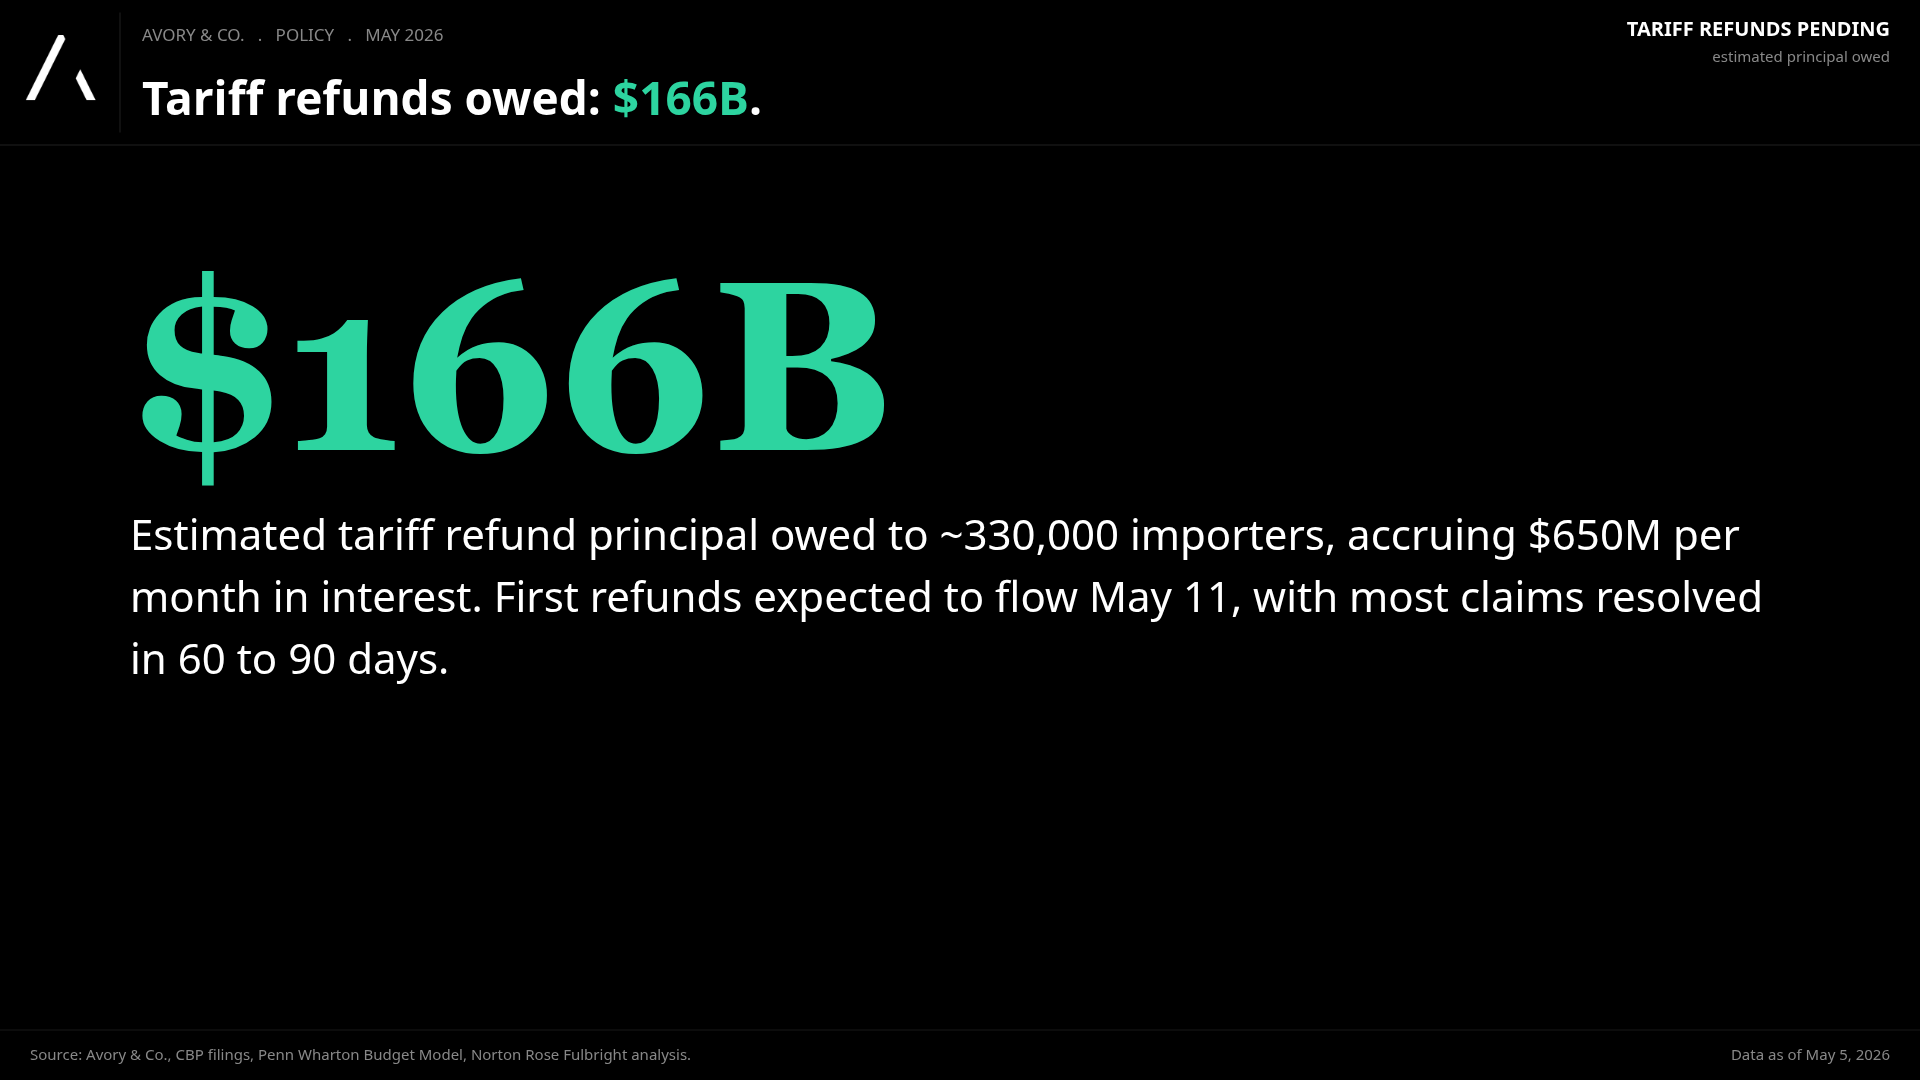
On February 20, 2026, the Supreme Court ruled 6-3 in Learning Resources, Inc. v. Trump that IEEPA does not authorize the President to impose tariffs. The Court of International Trade subsequently ordered Customs and Border Protection to refund the duties collected. As of the filings that prompted the CAPE refund portal launching on April 20, the government owes an estimated $166 billion to roughly 330,000 importers, with the outstanding balance accruing interest at about $650 million per month.
Even Penn Wharton’s independent estimate puts the refund total at up to $175 billion when interest is included. Either number is enormous.
For context, the entire 2024 tax refund total from the IRS was roughly $329 billion. We are talking about half a year of the entire IRS refund machine, landing on importer balance sheets in the back half of 2026.
There is a second-order effect that is just as important.
IEEPA tariffs represented roughly half of all customs duties collected by the end of 2025, running at roughly $18 to $20 billion per month in collections at year-end.
Going forward, those collections stop. Importers retain the cash that would have been remitted. On an annualized basis, that is a $200 billion plus run-rate boost that just structurally disappears from the tariff column.
Section 232 expansions on aluminum, steel, copper, and derivatives took effect April 6 and will claw back some of this, probably $30 to $60 billion per year by our estimate. But the gap between IEEPA cessation and Section 232 replacement is a real net positive in 2026.
The math, end to end.
What it actually nets to in dollars flowing through the system.
Here is the bridge, all in. Every line ties to our calculations above. I would view the number as directionally accurate given some of the unknowns in timing.
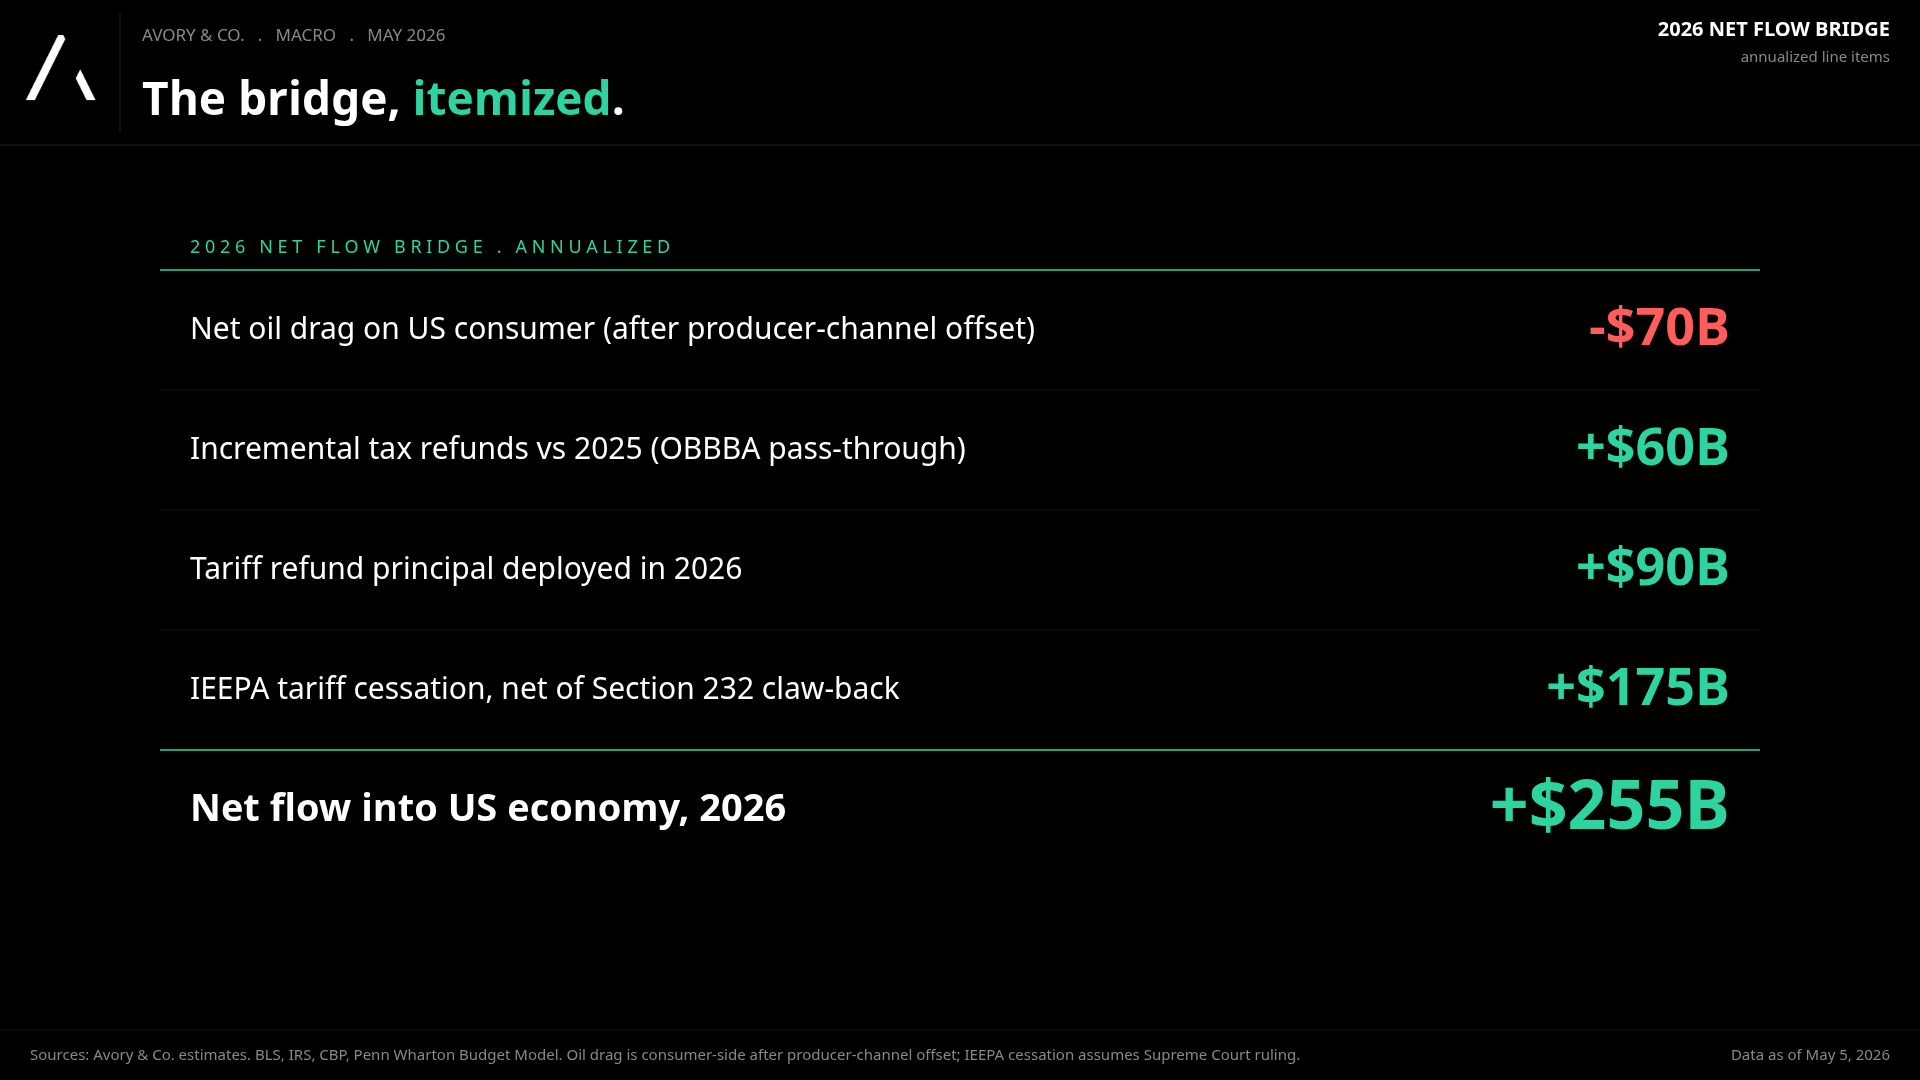
Here’s another visual.
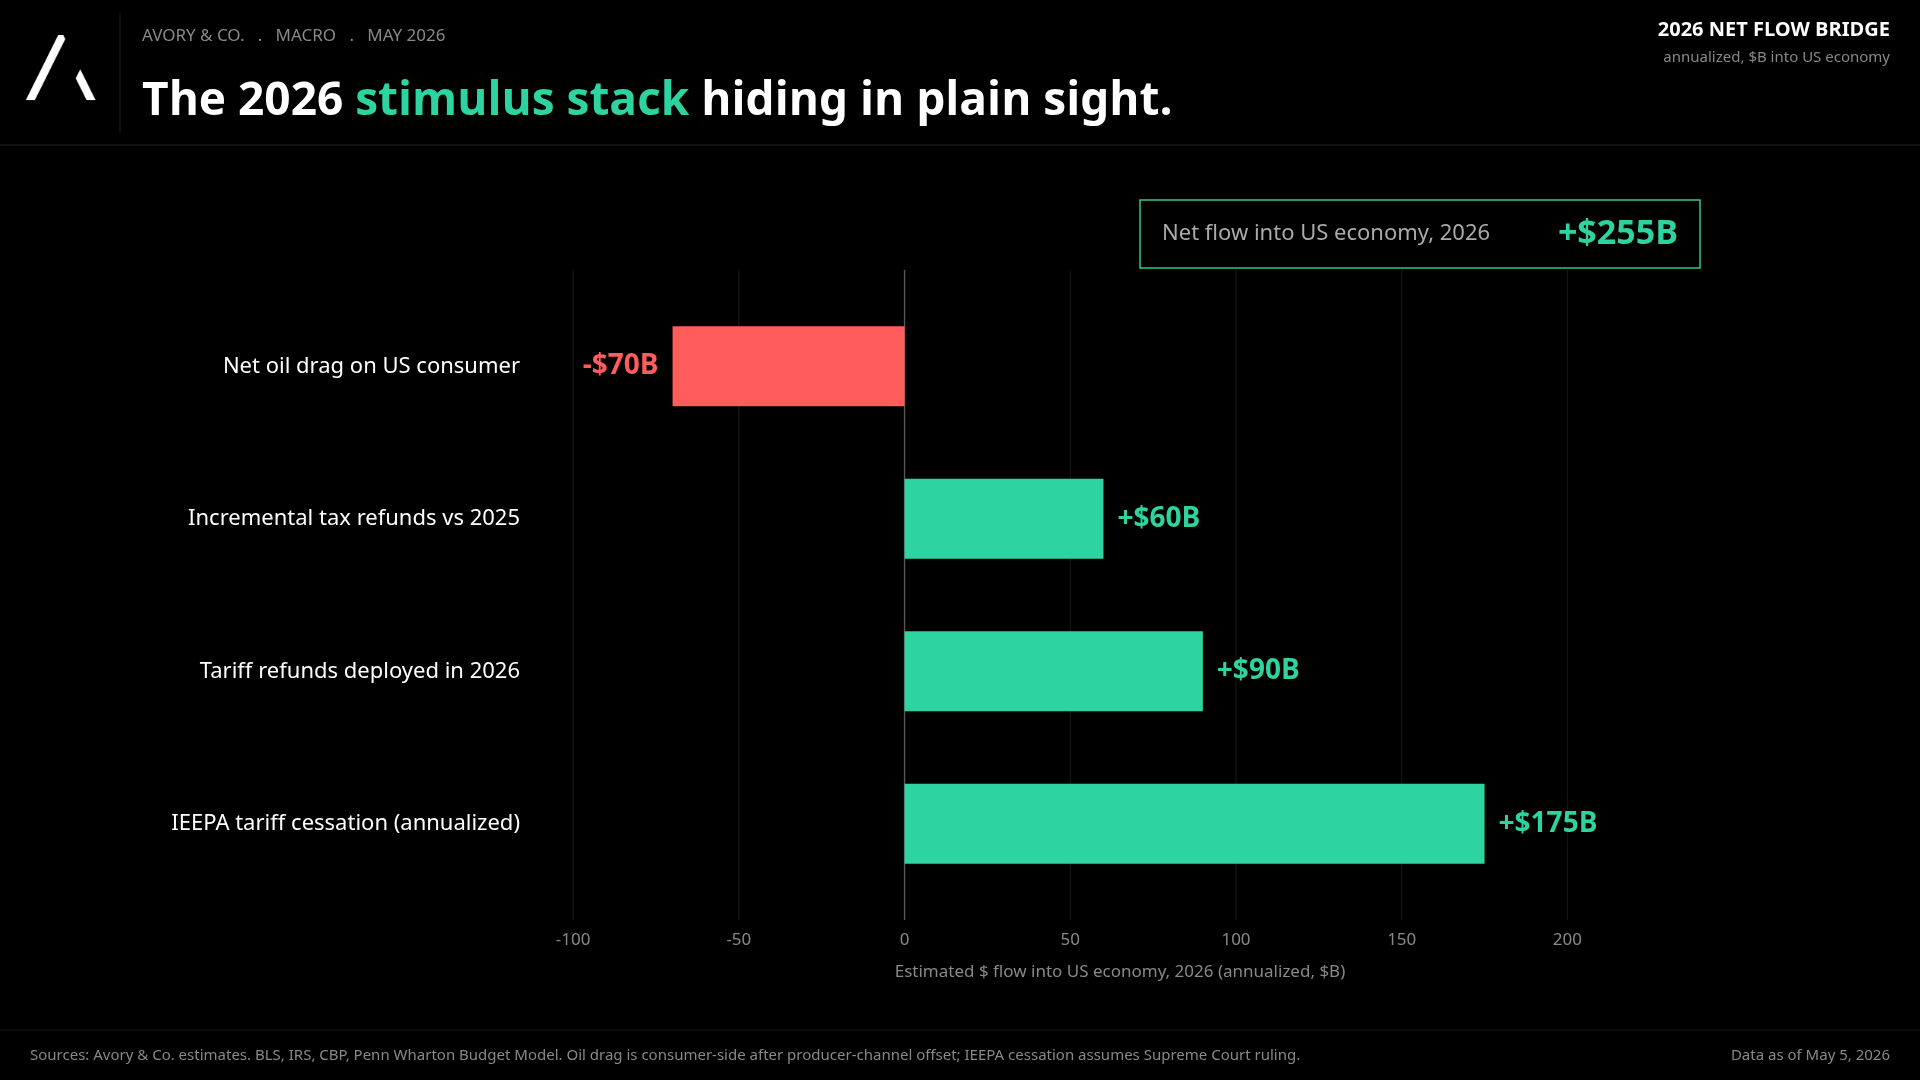
For scale: US nominal GDP printed $31.86 trillion in Q1 2026 per the BEA. That puts this net flow at roughly 75 to 90 basis points of GDP, on a one-year view, before any multiplier effect.
Tax refunds to households have a higher marginal propensity to consume than tariff refunds to importers, so blended through a 0.5 to 1.0 fiscal multiplier, the GDP impulse meaningfully expands.
And note the BEA’s own footnote on the Q1 2026 release: the IEEPA refunds are being treated as a capital transfer in the National Accounts, which means they are not yet reflected in the GDP print. That is upside still to come in the data, not behind us.
Why the market is doing what it is doing.
Good reminder to do the work don’t just read the terrifying headlines…
If you put all of this together, the market’s behavior stops looking irrational and starts looking like efficient pricing of a fiscal and regulatory regime change that the bear narrative has missed.
The oil drag is real but contained, the consumer is structurally less sensitive than 1970s playbooks assume, and the offsets are large and arriving in 2026.
Know another investor who'd find this useful? Forward it along or share on your page!About Avory & Co.
Investing Forward.
Avory specializes in high-conviction equity strategies, emphasizing Secular Growth and Transformation Stories driven by exceptional teams. Data guides decisions. We cater to high net worth investors, family offices, and institutional investors. Note: This information doesn’t constitute a recommendation to buy or sell any mentioned securities. Avory is based in Miami, Florida with clients all across the globe.
Speak to us:
Send us an email: Team@avoryco.com
Want to invest? We are on most platforms.
Want More
🎥 Avory YouTube”: Channel
🎙️ Avory: Podcast
Disclaimer: Not a recommendation to purchase or sell any securities mentioned. This is for educational purposes only.
SOURCES
Bureau of Labor Statistics. *Consumer Expenditures 2024.*Released December 19, 2025. Average annual gasoline spending of $2,411, or 3.1% of household expenditures. bls.gov/cex
RBC Economics. Oil price shock: Higher US inflation could weigh on consumers. 1970s energy spending share of 6 to 7 percent of real consumer spending. rbc.com/en/economics
Federal Reserve Bank of Kansas City. Çakır Melek & Vigfusson. The Evolving Link between Oil Prices and U.S. Consumer Spending. Economic Review, 2021. kansascityfed.org
ScienceDirect. Oil price pass-through into consumer prices: Evidence from U.S. weekly data. Long-run pass-through of approximately 4.2% to consumer prices.
U.S. Energy Information Administration. Crude oil and petroleum product prices increased sharply in the first quarter of 2026. Largest inflation-adjusted Brent quarterly move since 1988. eia.gov/todayinenergy
GuruFocus / EIA WTI series. Inflation-adjusted WTI of $99.89 as of April 27, 2026; long-run median $63.47.
Britannica Money. Highest Crude Oil Price. 2008 real peak ~$188; 2011 real peak ~$165. britannica.com/money
U.S. Energy Information Administration. U.S. energy facts: imports and exports. United States exported 55% of its petroleum production in 2024; net total energy exporter since 2019. eia.gov/energyexplained
Internal Revenue Service. Filing Season Statistics, weekly cumulative through April 17, 2026. Cumulative refunds of $296.1B vs $253.1B in 2025; average refund of $3,275, up 11.3% YoY. irs.gov/newsroom
Avory & Co. analysis. Tax refund pace and OBBBA pass-through tracking. +$43.0B cumulative delta vs 2025 same week; +17.0% YoY pace.
U.S. Supreme Court. *Learning Resources, Inc. v. Trump,*No. 24-1287, decided February 20, 2026.
Penn Wharton Budget Model. Supreme Court Tariff Ruling: IEEPA Revenue and Potential Refunds. Up to $175B in refunds; IEEPA at ~50% of customs duties; ~$20B/month in collections at year-end 2025. budgetmodel.wharton.upenn.edu
U.S. Customs and Border Protection. CAPE refund portal; ~330,000 importers, ~$166B principal, ~$650M/month interest accrual. Refund processing began April 20, 2026.
Norton Rose Fulbright. Potential refunds: US Supreme Court overturns IEEPA tariffs. Legal mechanics of refund and re-liquidation process.
BDO Global. Supreme Court Reins in IEEPA Tariff Authority: What Happens Now. Court of International Trade order of March 4, 2026; Section 232 expansions effective April 6, 2026.
U.S. Bureau of Economic Analysis. GDP Advance Estimate, 1st Quarter 2026. Released April 30, 2026. Nominal GDP of $31.856 trillion; IEEPA refunds treated as capital transfer. bea.gov