
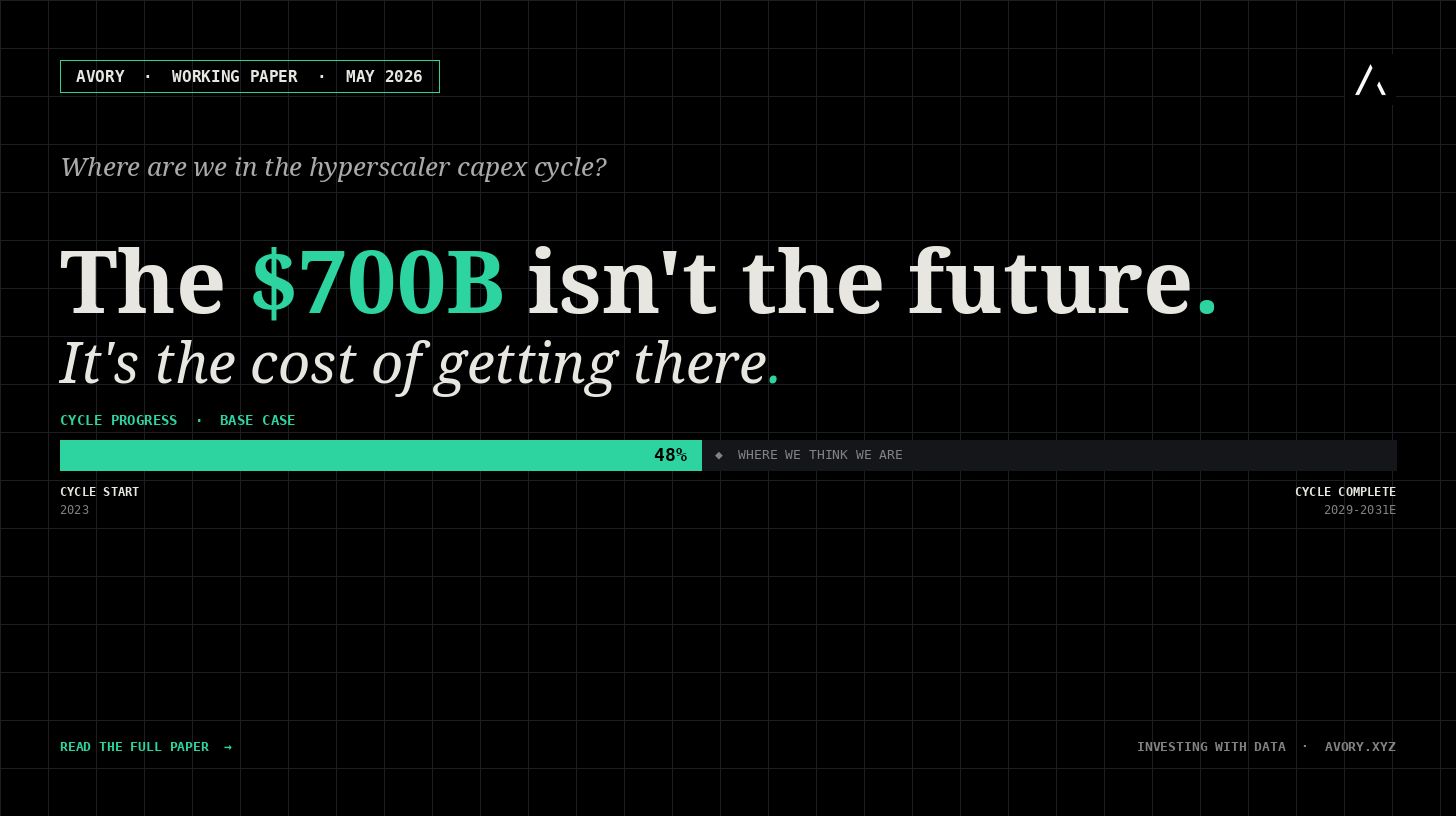
Where are we in the hyperscaler capex cycle?

Here is our take at Avory. If you want to read the actual piece in PDF format, see it here… Avory’s Analysis on on CAPEX CYCLE.
So lets start… This is an empirical analysis of the AI infrastructure buildout, updated with NVIDIA’s Q1 FY27 results released May 20, 2026. We look to test the prevailing market assumption / confusion that 2026’s roughly $700B in hyperscaler capex represents a new steady-state baseline. The data points to peak buildout still ahead, with implications for NVIDIA, the Big 4 hyperscalers, and Meta’s free cash flow trajectory as a sole example. We are investors in Meta for disclosure purposes, and anything in this research piece is not investment advice.
Abstract
Summary of findings
What the data shows.
This working paper addresses where the hyperscaler accelerated compute buildout stands within its overall cycle. We have witnessed many market participants treating 2026’s roughly $700 billion in Big 4 hyperscaler capex (Amazon, Google, Meta, Microsoft) as a permanent annual baseline. The empirical evidence suggests this is a misreading. Yes, capex is massive, but we think the market needs more clarity on what this spend represents. Here is our version of clarity.
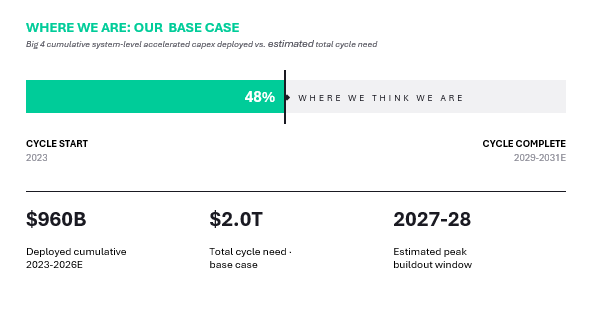
Using verified SEC filings, the latest NVIDIA Q1 FY27 results (released May 20, 2026), and a system-level replacement multiple methodology, we estimate the Big 4 are approximately 45 to 55 percent through the accelerated compute cycle on a dollar basis as of year-end 2026. The cycle is more advanced than chip-only models suggest because hyperscaler spending captures both silicon and supporting infrastructure (power, cooling, networking, buildings).
Peak Big 4 capex is most likely in 2027 to 2028 at $700 to $800 billion, with normalization to a steady-state run rate of $380 to $800 billion annually depending on refresh-rate assumptions. Even the most conservative scenario implies capex never returns to pre-AI levels. For Meta specifically, all three scenarios produce a 2032 EV/FCF multiple between 9.9x and 12.6x at the current $1.54T enterprise value, well below the S&P 500 average of ~25x.
KEY TAKEAWAY
The 2026 capex figure represents an acceleration of likely future capex, not a permanent baseline. The hyperscalers are replacing legacy general-purpose infrastructure with accelerated compute. The $700B isn’t the future; it is the cost of getting to the future.
1.The framing problem
The mistake we think people are making.
The same misreading keeps appearing in analyst notes and X threads. Analysts are taking the roughly $700 billion in 2026 hyperscaler capex and assuming that number persists annually into the future. Underwriting to that as if $700 billion is the new normal forever. The framing we think is wrong, and it leads to bad conclusions on both directions of the trade. The right way to think about this: capex spending right now is an acceleration of likely future capex, because the hyperscalers are replacing all of their current general-purpose infrastructure with accelerated compute. Their entire stacks need to run on accelerated compute eventually. The $700 billion isn’t the future, it is the cost of getting to the future.
METHODOLOGY
3 structural components of cycle need
We tried to build a model grounded in logic, knowing the future is unknowable. But history gives us clues. The goal is not to be perfectly accurate, but to think probabilistically, stay disciplined, and maintain a margin of safety. This is where we landed…
A / Replacement of pre-AI installed base
Cumulative Big 4 capex from 2015 to 2022 totaled approximately $475 billion, of which roughly 70 percent went to data center infrastructure. That puts the pre-AI installed base at around $330 billion in original cost basis. Replacement at 4-6x system multiple equals $1.3 to $2.0T.
B / Net new inference and training capacity
Token consumption is genuinely additive demand with no historical analog. Estimated 30 to 40 percent of current capex is net new capacity. This bucket scales with usage and has no natural terminal point.
C / Refresh of accelerated compute itself
Hidden compounding factor. With Amazon back to 5-year schedules and NVIDIA shipping new architectures every 18-24 months, a meaningful share of even recent GPU capex will need refresh inside this decade.
2. New data, released May 20, 2026
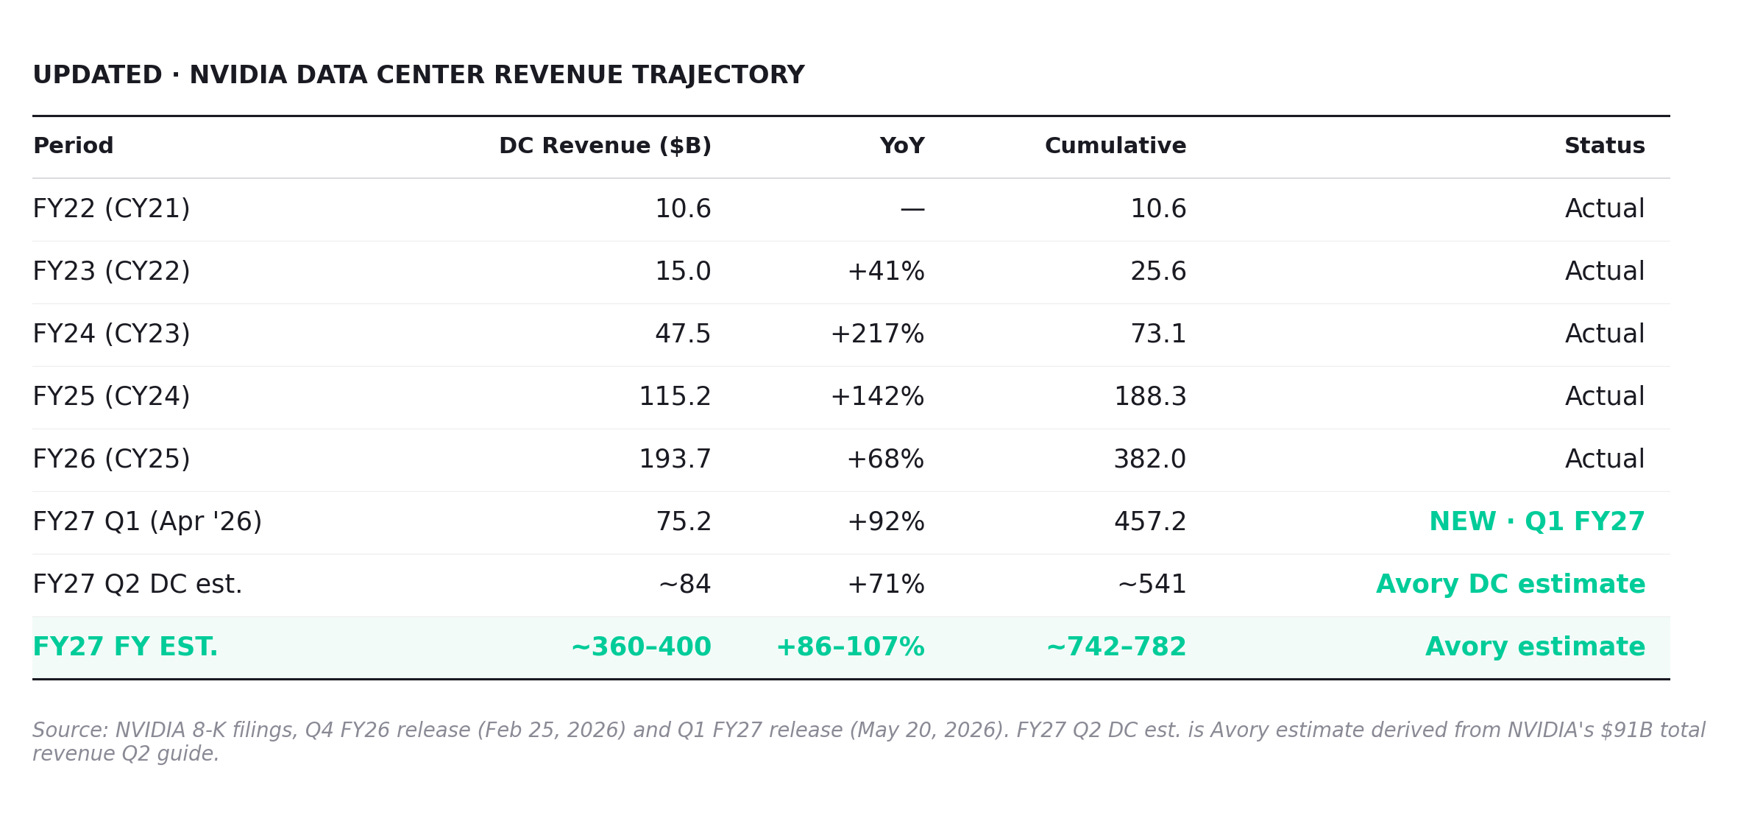
We have been tracking this thesis over the last year and we wanted to update and publish it. The latest report was May 20th. Nvidia revenue $81.6B (+85% YoY) vs $78.8B consensus. Data center revenue $75.2B (+92% YoY, +21% QoQ) vs $73B consensus. Q2 FY27 guide: $91B +/- 2% (vs $86.8B consensus), with no China DC revenue assumed. Hyperscale customers remain ~50% of data center revenue. Free cash flow $48.6B for the quarter. Gross margin held at 75%. This sets the tone...
WHAT THIS CHANGES.
The Q1 print and Q2 guide reinforced the structural thesis. Hyperscale customers continued to represent ~50% of data center revenue, meaning the buildout is being absorbed by the Big 4 plus Oracle, not redistributed to enterprise or sovereign customers (yet). Networking revenue of $14.8B in Q1 (up 199% YoY) suggests system-level capex is scaling proportionally with chip capex, validating the 2x silicon-to-system multiplier. So net net, we are still on track in terms of where we think we are relative to various points of views out there.
3. Where we stand in the cycle.
So starting, the big 4 cumulative system-level accelerated capex through end of 2026 is approximately $960B. A 4-year stacked total (2023 + 2024 + 2025 + 2026E), not a single-year figure. Cycle progress depends on what we believe total need is. The replacement multiple is the most sensitive input.
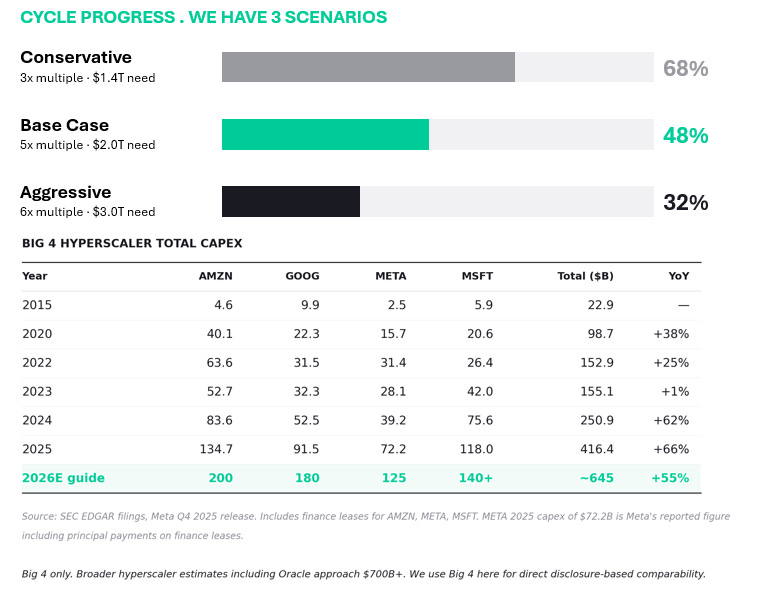
KEY OBSERVATION HERE.
If we are 48% through with $960B deployed, the remaining ~$1.04T needs to be spent over 2027-2030. That means annual accelerated capex must remain at $250-300B per year through 2030 to absorb cycle need.
4. Annual capex projections.
What annual spend actually looks like across scenarios
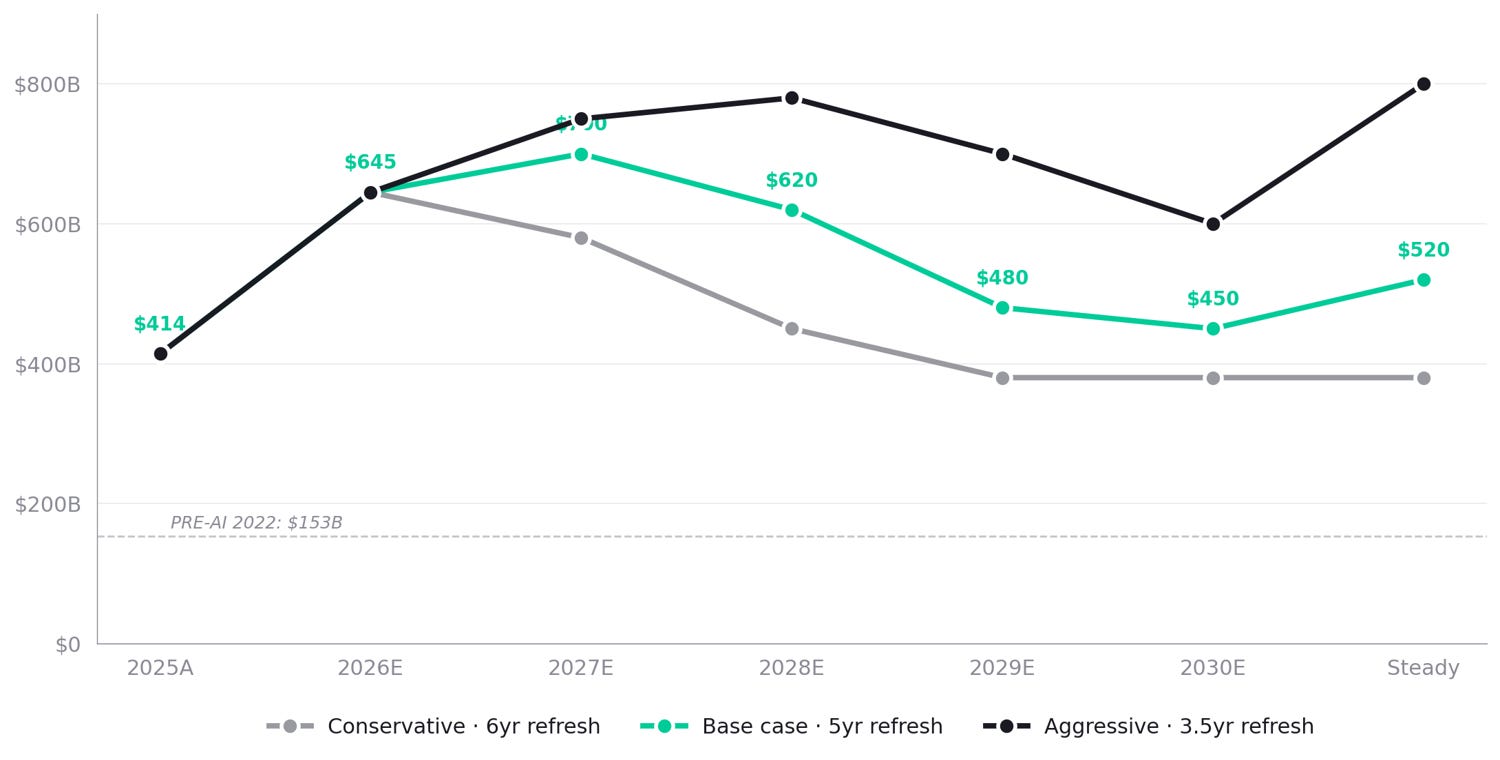
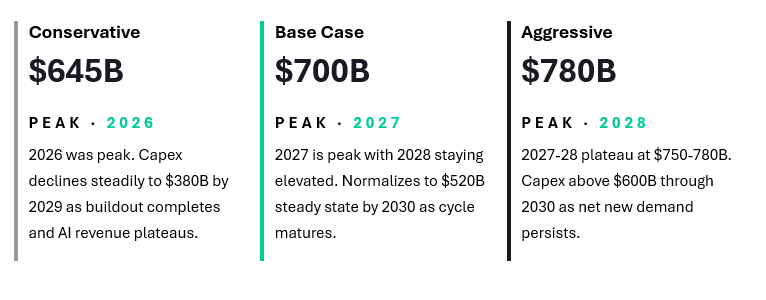
PEAK CAPEX BY SCENARIO
5. Meta deep dive (EXAMPLE)
Base case · 14% revenue CAGR · 5-year refresh · $1.54T EV anchor
Now for many reasons we wanted to put this into practice so one can see how CAPEX flows through PnL. $META is the cleanest test case for the refresh-rate thesis because it has no external cloud business to monetize the GPUs. Every dollar of accelerated capex must be justified by internal product improvement or new product revenue. We actually like that dynamic given their distribution and product velocity.
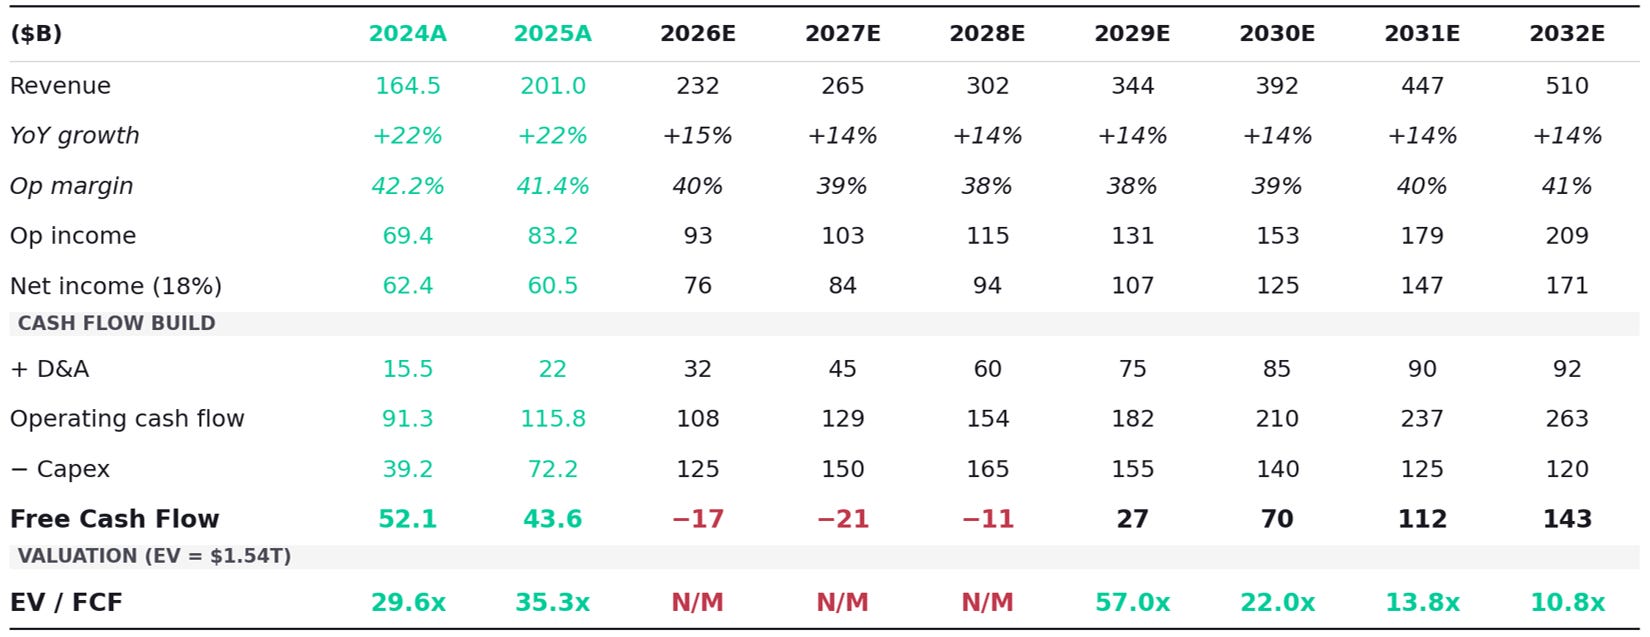
BASE CASE TAKEAWAY
If Meta trades flat at $1.54T EV through 2032, the multiple compresses to 10.8x EV/FCF. The S&P 500 trades at ~25x. Quality compounders trade 18-25x. The implication: either the stock re-rates higher as the path becomes clear, or FCF generation runs ahead of expectations.
Meta - Conservative Case
11% revenue CAGR · 6-year refresh · slower capex normalization
This assumes Meta’s AI investments hit diminishing returns by 2027-2028. Revenue growth slows to ad-market-plus modest share gains. Meta is forced (or chooses) to slow refresh cadence. Capex normalizes faster, but at the cost of competitive positioning.
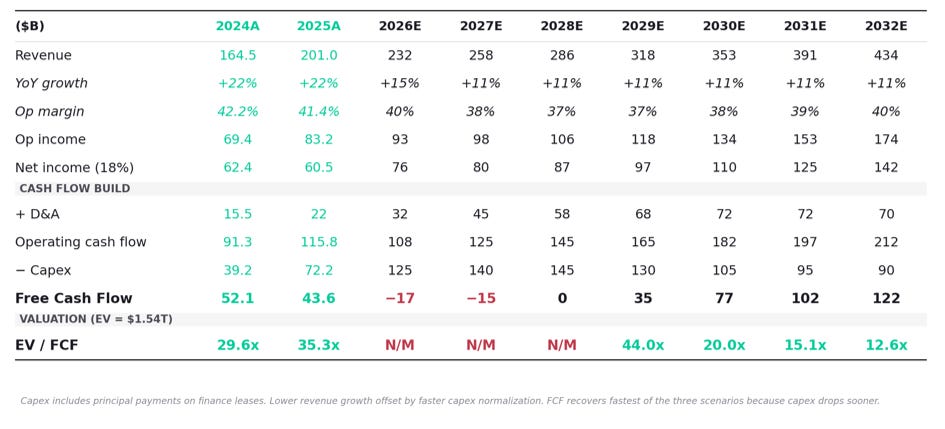
COUNTERINTUITIVE INSIGHT
The conservative case for AI capex is paradoxically the best near-term outcome for Meta’s FCF. FCF crosses back to positive by 2028 and reaches $77B by 2030, exceeding the 2024 baseline. The risk: if AI revenue underperforms, the EV may compress before the multiple does.
5. Synthesis of Meta Example
EV/FCF multiple paths converge by 2032
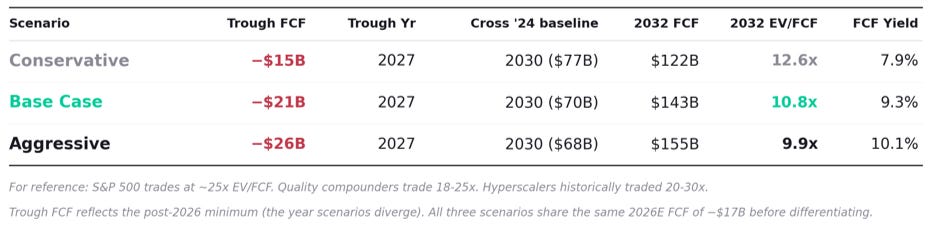
VIEW OF THE TABLE ABOVE
The terminal multiple range (9.9-12.6x) is remarkably tight despite very different scenario assumptions. The long-term math is more robust than the near-term volatility implies. For the sake of your time, we did not show the aggressive case example drawn out.
POSITIONING IMPLICATIONS
1.NVIDIA NVDA 0.00%↑ base case has accelerated capex growing through 2027, then declining in 2028, the timing window where the multiple is most at risk.
2.Cloud businesses on top of infrastructure (AWS, Azure, GCP) are the durability trade. Their economics depend on installed base utilization and pricing, not capex growth rates. But implication is they will normalize around 2x that of prior in aggregate.
3. Meta, as an example is uniquely positioned because it has no external cloud business. Some have seen as a negative, but makes no sense, as they are currently outgrowing their hyperscaler peers. Every dollar of capex must be justified by internal product improvement or new product revenue, the cleanest refresh-rate test case.
4. Power infrastructure, data center REITs, and electrical equipment makers benefit today and the steady-state floor has lifted, however, there will be a MASSIVE air pocket at the end of this as their refresh cycles are likely much longer than Nvidia.
Watch points & conclusion.
Variables that move the answer.
NEAR-TERM CATALYSTS (NEXT 12 MONTHS)
2027 hyperscaler capex guides (Jan-Feb 2027).
The most important data point. Aggregate Big 4 above $750B keeps base case alive. Below $700B activates bear case. Above $850B validates bull thesis.
NVIDIA Q2 FY27 results (August 2026).
Confirmation of the $91B guide vs actual. Sustained 70%+ YoY DC growth into Q2 would push the cycle math further toward bull.
Meta 2027 expense guide.
Expense growth driven by infrastructure costs, depreciation, infrastructure operating expenses. The 2027 guide implies the refresh cadence Meta is committing to. Also some color of flow through economics.
Custom silicon ramp at AMZN, GOOG, MSFT, META.
Trainium 3, TPU v6, MAIA, MTIA. Faster ramp = lower NVIDIA capture rate = different math on cycle progress allocation. This is Nvidia story, less so a accelerated compute story.
CONCLUSION.
The cycle is not what it appears.
The prevailing market narrative that 2026’s $700B in hyperscaler capex represents a permanent annual baseline is empirically wrong. Some understand this, but many do not, they see revenue and assume recurring. The data points to 2026 being near, but not at, peak buildout. Peak is most likely 2027 to 2028 at $700 to $800B, followed by normalization to a steady-state run rate of $380 to $800B annually. If you are an investor(as we are) then this should help you underwrite the next 3-5-7 years. If you are momentum trading then this is not about whether the cycle ends. It is about the slope of the descent and where the new floor settles. Position accordingly.
Know another investor who'd find this useful? Forward it along or share on your page!About Avory & Co.
Investing Forward.
Avory specializes in high-conviction equity strategies, emphasizing Secular Growth and Transformation Stories driven by exceptional teams. Data guides decisions. We cater to high net worth investors, family offices, and institutional investors. Note: This information doesn’t constitute a recommendation to buy or sell any mentioned securities. Avory is based in Miami, Florida with clients all across the globe.
Speak to us:
Send us an email: Team@avoryco.com
Want to invest? We are on most platforms.
Want More
🎥 Avory YouTube”: Channel
🎙️ Avory: Podcast
Disclaimer: Not a recommendation to purchase or sell any securities mentioned. This is for educational purposes only.
Sources & methodology
Working paper appendix
PRIMARY SOURCES
Bloomberg Data for earnings, revenue, consensus
NVIDIA Q1 FY27 earnings release and CFO commentary (sec.gov 8-K, May 20, 2026)
NVIDIA Q4 FY26 / Full Year FY26 earnings release (February 25, 2026)
Meta Q4 2024, Q4 2025, and Q1 2026 earnings releases
Platformonomics CAPEX Retrospective 2025 (Charles Fitzgerald, February 2026)
Epoch AI hyperscaler capex tracker (SEC EDGAR, Q1 2022 to Q4 2025)
Bloomberg projections
Methodology
All hyperscaler capex figures include finance leases where disclosed. Pre-AI baseline excludes Amazon retail capex using AWS-specific breakouts where available. Replacement multiple range (3x to 7x) captures the difference between like-for-like server swap and full system replacement (HBM, NVLink/InfiniBand, liquid cooling, power delivery). Hyperscaler share of NVIDIA DC revenue blended at 47% based on CSP commentary. The Q1 FY27 CFO commentary stated hyperscale customers remained ~50% of data center revenue. Custom silicon estimate (TPU, Trainium, MAIA, MTIA) carries the widest margin of error. Silicon-to-system multiplier of ~2x reflects that full hyperscaler accelerated capex includes the chip plus the buildings, power, cooling, and networking around it.
DISCLAIMER · Avory & Co. internal research working paper. Not investment advice. Distribution to clients and prospects of Avory & Co. only. Past performance not indicative of future results. Forward-looking projections subject to material revision as new data becomes available.
META 0.00%↑ GOOGL 0.00%↑ AMZN 0.00%↑ NVDA 0.00%↑ AMD 0.00%↑ IREN 0.00%↑ MSFT 0.00%↑